Farms

Farms

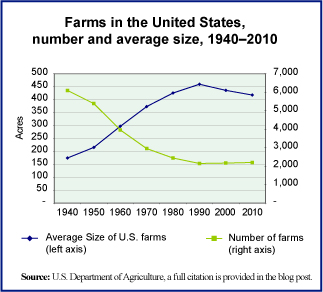
It takes far fewer acres to produce the food we need and in the United States the total number of acres used in agriculture have been shrinking for decades, while output has grown. The number of farms has also been shrinking as larger and more industrial-sized farms have come to dominate the market.

These trends in farming can be seen in the graph. It shows the number of farms and the average size of U.S. farms each decade since 1940. What we thought was of interest is the fact that there has been a small change in the century-long trend of growing average farm size. Since 1990, the average size of farms has actually shrunk, slightly, from 460 acres to 418 acres. There was also a slight increase in the number of farms between 2000 and 2010. The relatively small movement back to family or small-scale farming, and in particular organic farming, is large enough to be visible in the national statistics and on the size of the average farm in the United States.

Today’s market size is the total number of farms in the United States in 1990 and 2010 as well as the total value of farm output in those two years.

Geographic reference: United States
Year: 1990 and 2010
Market size: 1990: 2,146 farms with output valued at $180 billion
Market size: 2010: 2,201 farms with output valued at $300 billion
Sources: (1) “Table 824. Farms—Number and Acreage: 1990 to 2010,” Statistical Abstract of the United States: 2012, U.S. Census Bureau, December 2011, page 536, available online here. (2) “Table 1101. Farms—Number and Acreage: 1959 to 1989,” Statistical Abstract of the United States: 1990, U.S. Census Bureau, January 1990, page 638. (3) “Series K 1-16. Farm Populations, Land in Farms, and Value of Farm Property and Real Estate: 1850 to 1970,” Statistical Abstract of the United States: Colonial Times to 1970, U.S. Census Bureau, September 1975, page 457.
Original source: U.S. Department of Commerce, Bureau of the Census
Posted on January 10, 2014

Desalination Plants

In a process known as desalination (or desalinization), salt and other minerals are removed from seawater to produce fresh water suitable for human consumption. As world population rises the demand for fresh water rises even more rapidly since fresh water is used for more than direct human consumption. It is used in agriculture for both crop and livestock production as well as in industrial and mining operations. In particular, a growing quantity of water is being used around the world to extract oil, in both conventional oil well operations and, more notably yet, in hydraulic fracking operations used to extract oil and natural gas from sand tars and shale deposits.

The demand for desalinated water is rising at an estimated rate of 9% per year and is expected to continue to grow at this high rate for some time to come. Desalination plants around the world today produce approximately 65.2 million cubic meters of fresh water per day (24 billion m3 per year), which is equivalent to 0.6% of global water supply.

Today’s market size is an estimate of the money that will be invested to build new desalination plants worldwide between 2010 and 2016. Parts of the Middle East and North Africa are particularly invested in desalination technology, being regions particularly vulnerable to water shortages. In Saudi Arabia, for example, 70% of the total volume of drinking water consumed is supplied through the use of desalination technologies. The Middle East and North Africa are expected to see the largest share of the investments in desalination plants during the period shown here.

Geographic reference: World
Year: 2010–2016
Market size: $88 billion
Source: Water Desalination Using Renewable Energy, Technology Brief 115, March 2012, pages 3-4, available online here. “Saudi Per Capita Water Consumption 91% Higher Than International Average,” Saudi Gazette, September 1, 2012, available here.
Original source: The International Renewable Energy Agency (IRENA) and the International Energy Agency (IEA)
Posted on February 5, 2013

Waste & Scrap Exports

U.S. Waste Exports 2000-2011

With the growth of globalization and the increased demand on raw materials, the prices of basic commodities such as minerals, metals, wood, and paper have been volatile and have risen sharply since 2000. This has stimulated the trade in reusable waste and scrap materials, including international trade. Today’s market size is the value of all waste and scrap material exported from the United States in 2000 and in 2011.

The graph presents these data as well as the figures for the intervening years. It also shows by a differentiation in color on each bar the approximate share of the increased export value that is attributable to rising commodity prices and the share that is the result of actual increased volume. The dark blue portion of each bar is the value of exports in 2000 multiplied by the international commodity price index for minerals, ores and metals. (Please note that the Waste & Scrap category as a whole includes more than just minerals, ores and metals—although they do dominate the trade—therefore this calculation provides only an approximation). The lighter blue portion of each bar is the value of exports in excess of the inflation-adjusted value of exports in the year 2000.

Geographic reference: United States
Year: 2000 and 2011
Market size: $5.12 and $32.74 billion respectively
Source: “U.S. International Trade Statistics,” (910 Waste and Scrap), a searchable database presented by the Census Bureau and availalble online here. The commodity price index data used to calculate the inflation adjusted value of the 2000 exports is from “Free Market Commodity Price Indices, 1960–2011,” a report from the United National Conference on Trade and Development available online here.
Original source: U.S. Department of Commerce, Bureau of the Census and the UNCTAD
Posted on September 24, 2012

Bio-Based Manufacturing

In 2011, U.S. Senator Debbie Stabenow, Chairwoman of the Senate Committee on Agriculture, Nutrition, and Forestry introduced her “Grow It Here, Make It Here” initiative to spur growth in the emerging bio-based manufacturing industry. The initiative would provide a 30% tax cut for new, expanded, or re-equipped bio-manufacturing projects. Bio-based manufacturing uses agricultural goods, such as soy and wheat, to make value-added products, such as car parts, cleaning products, and plastics. This is not a new concept. Henry Ford used Michigan-grown soy and other agricultural products in his automobiles. In recent years, more and more automakers are using parts made from agricultural products. An example: the seats of the new Ford Focus and the Chevy Volt are made of Michigan-grown soy material.

Currently, bio-based products represent 4% of the plastic and chemical industry market. According to the U.S. Department of Agriculture, the potential market for bio-based plastic and chemicals could reach 20% by 2025 with federal policy support. Some studies show that if that 20% is reached, it would create more than 100,000 American jobs. This does, however, assume that agricultural production is able to keep up with strongly increasing demand and do so while maintaining competitive prices. Today’s market size is the estimated, current value of the bio-based economy in the United States.

Geographic reference: United States
Year: 2011
Market Size: $1.25 trillion
Source: “Stabenow Announces ‘Grow It Here, Make It Here’ Initiative to Advance Emerging Michigan Industry in Zeeland,” October 24, 2011, available online here.
Posted on November 4, 2011

Fish Catch

While many spend summer hours in the often leisurely act of fishing, we look today at fishery production for our market size. The market presented below is the size of the domestic catch in the United States for 2008. This does not include, of course, all those Rock Bass, Walleye, Trout, Bluegill, Pike and Perch being pulled from lakes and streams all over the country by sports fisherman. Rather it is the size of the commercial catch.

Geographic reference: United States
Year: 2008
Market size: 8,326 million pounds
Source: “Table 889. Fishery Products—Domestic Catch, Imports, and Disposition: 1990 to 2008,” Statistical Abstract of the United States 2011, January 2011, page 566, available online here.
Original source: U.S. Census Bureau

Minerals in Wyoming

Taxable value of WY minerals

Mining and extraction industries in Wyoming saw a significant decline in 2009 after peaking in 2008 for the decade but 2010 saw a strong recovery over 2009. The graph shows taxable value for all minerals extracted annually in Wyoming from 2001 through 2010. Wyoming’s mineral wealth is providing the state with a strong base for recovery from the recession that began in December 2007.

Today’s market size is the total value of all minerals extracted in 2010. The minerals included in this total are oil, natural gas, coal, bentonite, trona, uranium, sand and gravel.

Geographic reference: United States
Year: 2001 and 2010
Market size: $6.74 and $15.49 billion respectively
Source: Barron, Joan, “State’s Mineral Valuation Booms,” Casper Star Tribune, June 1, 2011, page 1.
Original source: State of Wyoming

Crude Oil Supply

Based on a report recently issued by the U.S. Energy Information Administration, the supply of crude oil for U.S. energy needs, from all sources, is anticipated to decline between 2009 and 2025. On a per capita basis this decline is rather large, 15.3%. This is because the population is projected to increase by 16.4% between 2009 and 2025 while the supply of crude oil is forecast to decline by 1.39%. Obviously, new sources of petroleum supply will be (are) in high demand, not to mention all other forms of energy.

Today’s market size is the daily supply in millions of barrels per day (mbpd) of crude oil in the United States, for 2009 and projected for 2025.

Geographic reference: United States
Year: 2009 and 2025
Market size: In 2009, 14.33 mbpd and in 2025, 14.13 mbpd
Source: “Table C4. Liquid Fuel Supply and Disposition,” Annual Energy Outlook 2011, With Projections to 2035, April 2011, page 175, available online here.
Original source: U.S. Department of Energy, Energy Information Administration

Electricity from Renewables

Renewable Energy Sources Worldwide

Hydroelectric power plants are the largest producers of electricity from renewable sources. As we saw in yesterday’s Market Size post, they represented 15.97% of world electricity production in 2008. That same year, electricity produced by all other renewable sources accounted for 2.4% of electricity generated. While responsible for only a small percentage of all electricity generation now, renewable sources are forecast to grow steadily through 2035 at which point the nonhydropower portion will account for 7.26% of global production.

The pie chart shows how electricity is generated worldwide and provides a detail of the small pie slice that represents nonhydropower renewables. The renewable energy source that is forecast to grow most quickly in the next decade is solar.

Please note that the Energy Information Administration (EIA) projections exclude electricity generated by so-called off-grid sources, thus renewable energy consumed at the site of production. Energy produced by solar panels installed, for example, on a private home for the sole and exclusive use of the residents of that home is not counted in the EIA projections. If, however, those solar panels are tied into the public electric grid, then the electricity they generate is accounted for in the EIA projections. Time will tell how significant these off-grid electricity generation resources become.

Geographic reference: World
Year: 2007 and 2035
Market size: 463 and 2,554 billion kilowatt hours respectively (please note this is the size of electicity generation from nonhydropower renewable sources)
Source: “Table 12. OECD and Non-OECD Net Renewable Electricity Generation by Energy Source, 2007-2035,” International Energy Outlook 2010, report available online here.
Original source: U.S. Energy Information Administration (EIA)

Fishing and Aquaculture

As the world population grows, so do all efforts to feed that population. An important resource in this effort are our inland waterways, oceans and seas. Aquaculture—the cultivation of aquatic plants and animals also referred to as aquafarming—is the fastest growing sector within this industry. Fishing in the wild is, in many places, becoming more difficult because of regulations to prevent overfishing or because overfishing itself has already caused a serious decline in the fish population, as happened to dramatic effect off the eastern coast of Canada in the early 1990s.

Tomorrow we’ll look at the aquaculture portion of this market.

The market sizes presented here do not include aquatic plants but do cover all caught and raised fish of any kind from marine and inland waterway sources.

Geographic reference: World
Year: 1998 and 2008
Market size: 117.2 and 142.3 million tons respectively. Approximately 80% of both year’s totals were for human consumption—93.3 and 115.1 million tons respectively.
Source: “Table — 1 World Fisheries and Aquaculture Production and Utilization,” The State of Fisheries & Aquaculture 2010, page 3, available online here. The data for 1998 are from the 2000 edition of this same report, same table number, page 6, and available online here.
Original source: United Nations, Food & Agriculture Organization (FAO), Fisheries and Aquaculture Department.

National Park Visitors

The size of the market for national parks is provided based on visitors to these parks annually. The most visited of the national parks is Golden Gate National Park in San Francisco, California.

Geographic reference: United States
Year: 2009
Market size: 94.5 million visitors
Source: “National Park Summary Visitors Report,” May 2010 available online here.