Movie Tickets

The Motion Picture Association of America tracks movie box office receipts very closely. The resulting statistics are available rather quickly for North America but they take longer to come in from other parts of the world. Revenues from theatrical releases of a movie are only the beginning of the revenue generated by a film. Nonetheless, they are important to the movie industry and they are growing most strongly outside the industrialized world, where the number of theaters being opened annually is rising.

Today’s market size is the global box office revenue in 2008 and 2012, with a geographical breakdown to show what percentage of the total revenue was generated in the U.S. and Canada.

Geographic reference: World
Year: 2008 and 2012
Market size: $27.7 billion (U.S./Canada 53.3%) and $34.7 billion (U.S./Canada 45.2%)
Source: “Global Box Office—All Firms (US$ Billions),” Theatrical Market Statistics 2012, MPAA, Summer 2013, page 4, available online here.
Original source: Motion Picture Association of America, Inc. and Rentrak Corporation
Posted on April 2, 2014

Expenditures on Reading Materials

The U.S. Bureau of Labor Statistics (BLS) carries out an annual survey of millions of households to track what they spend money on, by category. The resulting data has been collected over decades and seeing the trends that these data expose over time is very interesting.

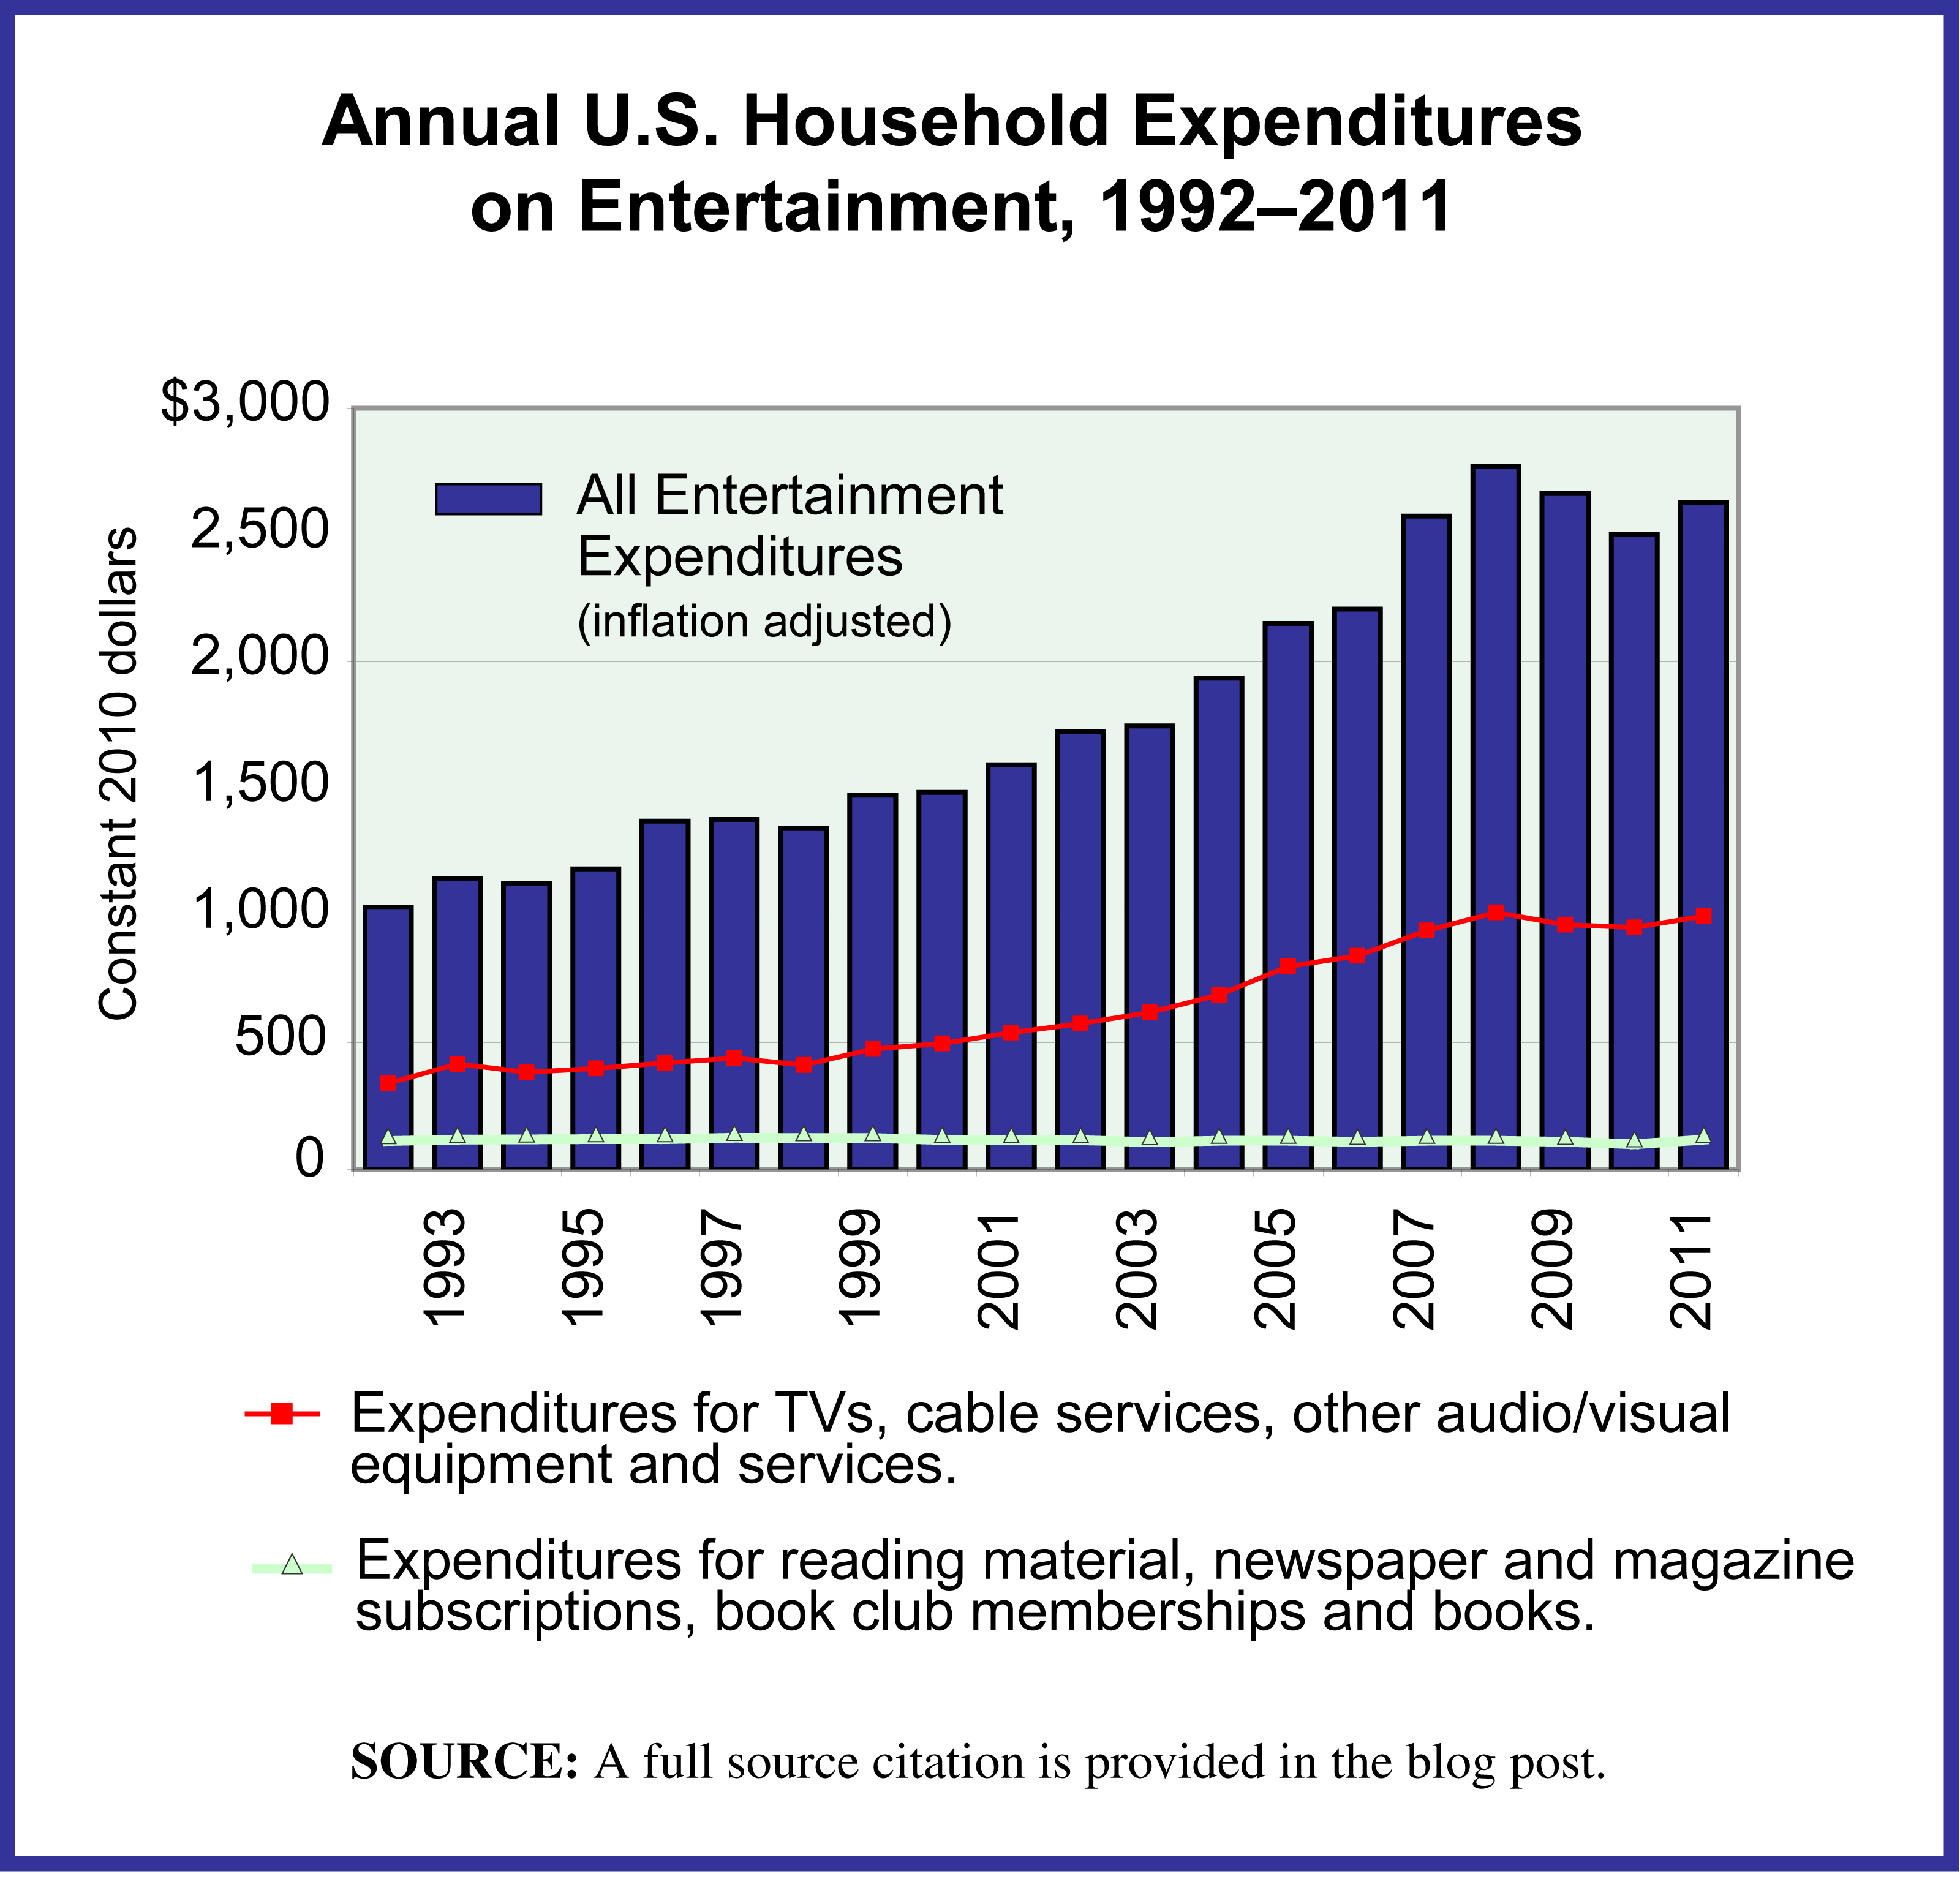
The graph presented here is made with BLS data from this survey series. It shows inflation-adjusted household expenditures on all categories of entertainment, as well as two subsets of expenditures, (1) those for TVs, audio/video equipment and services, such as cable subscriptions and (2) expenditures for reading material. The full category of entertainment expenditures is broad and includes things such as:

—Fees to attend concerts, sporting events, movies, and sporting clubs/fraternal organizations.
—TVs, radios and other audio/video equipment as well as subscriptions for cable, premium TV and the like.
—Pets, toys and hobbies, as well as all the services and equipment related to those.
—Bikes, athletic shoes, and equipment for camping, exercising, fishing, and all sports, as well as boats and docking fees, fireworks, pinball machines and video consoles.

Today’s market size is the average spent by U.S. households on reading material in 1994 and in 2011. The figures do not include expenditures for any textbooks or reading material purchased as part of a formal educational program. The transition to digital which is taking place in most areas of publishing is not well tracked by this BLS survey series. It is unclear from studying the survey results, for example, whether or not all online subscriptions to newspapers and magazines are consistently captured in the expenditure category “Reading.” Over time this will change as time allows data collection organizations, like the BLS, to adjust to the digital transition. Data collection organizations can only adjust as quickly as the industries they cover—in this case, the publishing industry—adjust to such dramatic changes.

Geographic reference: United States
Year: 1994 and 2011
Market size: $165 and $115 respectively. These figures translate to a national gross household spending on reading materials for each of those years of $16.86 billion and $14.06 billion respectively
Source: “Consumer Expenditure Survey,” Multiyear Tables: 1992-99 Multiyear Table, 2000-05 Multiyear Table, and 2006-11 Multiyear Table, all available on the Bureau of Labor Statistics website here.
Original source: U.S. Department of Labor, Bureau of Labor Statistics, Consumer Expenditure Surveys
Posted on May 9, 2013

Movie Theater Box-Office

Americans love movies but in the last few years we’ve been deciding more and more often to watch them at home or on-the-go and not in movie theaters. Technology has made that possible and theater ticket sales are declining as a result. In other words, attendance is down. While the number of tickets sold has declined, the revenue those tickets bring in is not dropping as quickly since ticket prices are rising.

Today’s market is the market for movie theater attendance in the United States and Canada in 1990, 2010 and 2011.

Geographic reference: United States and Canada
Year: 1990, 2010 and 2011
Market size: [tickets sold] 1.19, 1.34, and 1.28 billion respectively
Market size: [box-office] $5.02, $10.6 and 10.2 billion respectively
Source: “Movie Ticket Sales Slump: Theater Owners Try Booting Texters, Digital Upgrades, More Popcorn,” The Huffington Post, January 9, 2012, available here.
Original source: National Association of Theater Owners, the website for which is here.

Video Games

According to the Entertainment Software Association, 72 percent of households in the United States own a video game machine. Initially video games were targeted to males, but by 2010 48 percent of gamers were female. And, although nearly all children aged 12-17 play video or computer games, the average gamer is 37 years old. Nearly one-third of gamers are older than 50.

Data show the amount consumers spend on video games in the United States. To provide some perspective, in 2010, worldwide motion picture ticket sales totaled $31.0 billion. Figures for 2012 are projected.

Geographic reference: United States
Year: 2010 and 2012
Market Size: $25.1 billion and $70.0 billion
Source: Thomas L. McDonald, “Get in the Game,” The Catholic Times, October 1-7, 2011, page 6
Original Source: Entertainment Software Association
Posted on October 20, 2011

Streaming Video

Netflix and Hulu are two services that allow their customers to stream videos. A March 2011 Nielsen survey found that a majority of Netflix users who stream videos watch them on their TVs through gaming consoles, while a majority of Hulu users stream video on their computers.

Data are the number of videos streamed in the United States in May 2011. This was an all-time high.

Geographic reference: United States
Year: May 2011
Market size: 15 billion videos
Source: The Associated Press, “Half of Netflix Use Done on Consoles,” Lansing State Journal, July 31, 2011, page 4E

Home Entertainment Market

Home Entertainment Spending, 2000-2010

Today’s market size is the value of spending on the home entertainment segment related to films and all forms of videos that are rented and purchased, on DVD, CD, and downloaded electronically. The graph shows how this market has fared for the first decade of this century and shows that even the strong home entertainment segment has seen declines during the recession that started in December 2007. Actually, spending in this market peaked in 2004 and 2005 and has declined slightly every year since then.

Geographic reference: United States
Year: 2010
Market size: $18.8 billion
Source: “DEG Year-End 2010 Home Entertainment Report,” a report produced by the industry-funded nonprofit corporation Digital Entertainment Group. The report is available online here.

Home Movie Rentals

The ways in which people obtain the movies they wish to watch at home have multiplied and changed over time, altering this market greatly. In 2005 the video rental store still had a 74% share of this market but this share has declined in favor of companies that offer a mail-in form of service, like Netflix, as well as kiosk style retail outlets. By way of punctuating this transition, in late summer 2010, Blockbuster, one of the largest video rental store chains still operating, filed for bankruptcy.

The market size listed here includes the following categories of video rental outlet: Subscriptions, Kiosks, Traditional Video-on-Demand (VOD), Video Stores, and Internet VOD.

Geographic reference: United States
Year: 2010
Market size: $7.8 billion
Source: USA TODAY, September 23, 2010, page 2B.
Original source: Screen Digest

Movie Tickets

Some people wonder why so many Hollywood movies seem to be written to appeal to a very youthful crowd. As it turns out, this has to do with the fact that young people, aged 12 to 24 years, purchase a disproportionately high percentage of all movie tickets, disproportionate as compared to their representation within the population. In North America, young people aged 12 to 24 years represents 18% of the population but in 2010 bought 32% of movie tickets.

Geographic reference: North America
Year: 2010
Market size: 1.34 billion movie tickets.
Source: Barnes, Brooks and Michael Cieply, “Graying Audience Returns to Movies, in Glasses That Aren’t 3-D,” The New York Times, February 26, 2011, page 1.
Original source: Motion Picture Association of America

Motion Picture and Video Industries

This industry comprises the whole large group of companies engaged primarily in the production and/or distribution of motion pictures, videos, television programs, or commercials; in the exhibition of motion pictures; or in the provision of postproduction and related services.

Geographic reference: United States
Year: 2002 and 2007
Market size: $62 billion and $80 billion respectively
Source: 2002 Economic Census and 2007 Economic Census, October 30, 2009. The 2007 data on the Information sector is available online here.
Original source: U.S. Bureau of the Census