U.S. Veteran Population

Veterans2

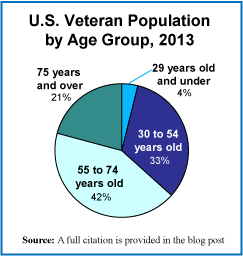
Today we present a brief market size post on the U.S. veteran population, in honor of those veterans on this Veteran’s Day. The pie chart shows the population broken down into four age groups. While the total number of veterans has been declining for many decades now, the number of veterans living with service-connected disabilities has been rising. Between 1990 and 2012, the number of veterans with service-connected disabilities grew by 46%.

Geographic reference: United States
Year: 2013 and a projection for 2020
Market size: 21,972,964 and 19,604,276 respectively
Sources: (1) “Table 1L: VETPOP2011 Living Veterans by Age Group, 2010-2040,” a statistical table made available by the U.S. Department of Veterans Affairs on their website here, towards the bottom of the page on the right side. (2) “Trends in the Utilization of VA Programs and Services,” prepared by the National Center for Veterans Analysis and Statistics, January 2012, available online here.
Original source: U.S. Department of Veterans Affairs
Posted on November 11, 2013

U.S. Military Personnel

Today’s market size is one of those that we do from time to time that takes liberty with the term “market.” It is the number of people employed by the U.S. Department of Defense, as active duty personnel as well as civilian employees.

Geographic reference: United States
Year: U.S. Budgetary Fiscal Year 2013
Market size: 1,478,000 active duty and 791,000 civilians
Source: “Table 7-5 Department of Defense Manpower,” National Defense Budget Estimates for FY 2013, March 2012, page 259-260. This publication is often referred to as the “Greenbook.” It is available online here.
Original source: Office of the Under Secretary of Defense, U.S. Department of Defense
Posted on September 11, 2013

Military Active Duty

Today’s market size is the number of active duty military personnel in the United States and in China. When looking at comparative national data, always be sure to take into account how the measure… measures up, if you will, on a per capita basis.

Geographic reference: China and United States
Year: 2011
Market size: China: 2,285,000 (equal to 1.69 persons per 1,000 in the population)
Market size: United States: 1,430,000 (equal to 4.52 persons per 1,000 in the population)
Source: “The Growth of The Chinese Military,” Military Education, A Non-Government Military Education Resource, available online here. Various figures were also taken from the CIA World Factbook, available here.
Original Source: Central Intelligence Agency
Posted on June 14, 2013

U.S. Active Duty Military

Active Duty Military, 1990-2011

Today’s market size is the size of the population of U.S. active duty military personnel. The chart to the right shows active duty military personnel figures from 1990 through August of 2011. The declining trend in this population, which appears clearly in the chart, is somewhat surprising given the United States’ involvement in “hostilities” in several parts of the world since 1990. One can see what appears at first blush to be a similarity with the economy at large in terms of reduced demand for labor and increased outsourcing. However, we only mention this seeming similarity here because such an assertion would require far more study and analysis to either present properly or disprove.

Geographic reference: United States
Year: 2010
Market size: 1.43 million
Source: “Table 510. Department of Defense Personnel: 1960 to 2010,” 2012 Statistical Abstract of the United States, page 335, available online through the Census Bureau’s website, here.
Original source: U.S. Department of Commerce, Bureau of the Census and the U.S. Department of Defense.
Posted on January 7, 2013

Launchers for UAVs

Some unmanned aerial vehicles (UAVs) are controlled by a navigator from a remote location and others fly autonomously based on pre-programmed flight plans. These aircraft carry cameras, sensors, and communication equipment. Unmanned combat aerial vehicles, also known as combat drones, are armed and have been used in various wars since the 1980s.

Although unmanned aerial vehicles are used primarily by the military, recently they’ve also been used in fighting large fires, in support of border patrol activities, and in the surveillance of pipelines. Launchers for these vehicles are portable so that they can be placed in remote areas, without a need for an airport. They are also modular so that components can be replaced easily and used in multiple configurations. Data show the market size of the launchers for unmanned aerial vehicles for 2011 and estimated market size for 2018.

Geographic reference: Worldwide
Year: 2011 and 2018
Market Size: $118 million and $1.3 billion respectively
Sources: “Summary: Launchers for Unmanned Aerial Systems and Targets: Market Shares, Strategies, and Forecasts, Worldwide, 2012 to 2018,” ReportLinker, August 2012, available online here; “Unmanned Aerial Vehicle,” Wikipedia, October 7, 2012, available online here; “Unmanned Combat Air Vehicle,” Wikipedia, October 2, 2012, available online here; and “Unmanned Aerial System,” Institute for Defense and Government Advancement, 2012, available online here.
Posted on October 12, 2012

Military Expenditures Worldwide

On the 11th anniversary of terrorist attacks on the United States, we look at military spending for today’s market size post. According to a recent report by the Stockholm International Peace Research Institute which tracks military spending worldwide, the response to the September 11 attacks was “one of the dominating factors of the global security environment over the past 10 years, and a key factor influencing military spending in many countries.

Today’s market size is the measure of all military expenditures by countries around the world in 2011, of which the top three by overall spending were the United States with 41% of the total expenditure, China with 8%, and Russia with 4%.

Geographic reference: World
Year: 2011
Market size: $1.738 trillion
Source: SIPRI Yearbook 2012, Armaments, Disarmament, and International Security, Summary, pages 8-9, published in 2012 by the Stockholm International Peace Research Institute. The summary report is availalble online here.
Original source: SIPRI
Posted on September 11, 2012

Veterans Enrolled in the VA

Today’s post is about veterans since it is the holiday we have designated for remembering our veterans of foreign wars. The Department of Veterans Affairs has since 1999 done an annual survey to help track the number of veterans who are enrolled to receive health benefits through the Veterans Administration (VA). It may surprise some people to discover that a veteran of the U.S. military would even need to enroll in anything to receive VA benefits but things are more complicated as it turns out.

Here is an explanation from the VA on the need to enroll annually for some veterans. “Enrollments are renewed annually and many veterans will stay enrolled each year without any action on their part. Most veterans who are not receiving monthly compensation or pension checks from VA, however, must complete an annual financial statement known as a Means Test. Completing a Means Test allows the VA to place you in the correct Priority Group for determination of copayments. It also ensures that your local VA receives reimbursement from VA for the health care provided to you.”
Link to quoted source.

The market size listed below is the number of U.S. veterans enrolled to receive VA benefits in 2002 and in 2010.

Geographic reference: United States
Year: 2002 and 2010
Market size: 6.2 million (approximately 25% of the veteran population in 2002) and 7.8 million (approximately 35% of the veteran population in 2010)
Source: “Table 7.1—Perceived Health Status by Year,” 2010 Survey of Veteran
Enrollees’ Health and Reliance Upon VA,
July 2011, page 74, available in a PDF format here.
Original source: U.S. Department of Veterans Affairs
Posted on 11/11/11

Military Spending

Spending on the military varies greatly from country to country and in part, because of concerns about national security, acquiring information about just what is spent in each country is very difficult. The Stockholm International Peace Research Institute studies this topic and tracks it, publishing an international yearbook with statistics on the same. It has done this since 1969, making the 2010 edition of its yearbook the 41st edition.

The United States ranks at the top of the list of military spending by nation, as it has for decades. In 2009 the United States’ military spending represented 43% of world military spending. The United States’ share of world military spending has consistently been above 40% since the SIPRI Yearbook has been published.

Geographic reference: World
Year: 2009
Market size: $1.531 trillion
Source: “The Top 10 Military Spenders, 2009,” SIPRI Yearbook 2010, Armaments, Disarmament and International Security, page 11, available online here.
Original source: Stockholm International Peace Research Institute

Veteran Population

Military Population

The number of military veterans in the United States is our focus on this Veterans Day.

The chart we present here shows three population figures over more than a half century: Active Duty Military, Military Veterans, and the overall population, by way of comparison. The veterans population is shown as the dark blue columns along the bottom of the chart.

We offer our sincere thanks to all those who have served—or are serving—this country in one of our military branches.

Geographic reference: United States
Year: 1980 and 2008
Market size: 28.6 million and 23.2 million respectively
Source: Statistical Abstract of the United States, editions 1980, 1990 and 2010. Recent editions are available online here.
Original source: U.S. Bureau of the Census