Vibration Control Systems

helicopter with vibration control system
A motion control system helps reduce vibration in a helicopter’s fuselage generated by the main rotor. A motion control system is a type of vibration control system.
Vibration control systems (VCS) are used to control vibrations and motion in machines in order to increase their efficiency as well as the life span of the components. Vibration can cause wear and tear on machine parts and that in turn can lead to cracks and breakage. Originally vibration control systems were designed for use in automotive and electrical equipment. The electrical and electronics segments claimed 15% of the global market in 2019 but significant growth is expected through 2027 due to the increase in the manufacturing of industrial machinery worldwide.1

Nowadays these systems are also being used in the aerospace and defense, oil and gas, mining, quarrying, and healthcare industries. Pharmaceutical companies are using VCS to diminish the effects of vibration on sensitive equipment such as magnetic resonance imaging machines and DNA sequencing microarrays.

Today’s market size shows the global vibration control system revenues for 2019 and projected for 2027. Vibration control systems for the automotive and aviation industries are expected to drive growth in the industry. VCS manufacturers are being compelled to upgrade their products due to strict regulations and policies set by the United States government and airline regulatory agencies. Overall, demand is increasing for self-controlling, smart, adaptive VCS; web-based continuous machine condition monitoring; and Active Noise and Vibration Control Systems in aircraft.

In 2019, Europe had the highest revenue share due to a large number of automobile manufacturers in the region. North America had a market share of more than 19%. This region was an early adopter of vibration control systems, with large-scale systems being used in the U.S. electronics and electrical, automotive, and food manufacturing sectors. Growing demand for VCS in the United States and Canadian healthcare, aviation, and defense industries will contribute to revenue growth in the coming years. Many manufacturers and solution providers are located in North America. Many major manufacturers are also located in China. The Asia-Pacific region is expected to experience the fastest growth owing to rapid industrialization in China, Japan, and India. Rapid development in Brazil’s oil and gas, textile, automotive, and machinery and equipment industries will contribute to growth in Latin America. Some leading companies include ContiTech AG, Lord Corp., Resistoflex Pvt. Ltd., Hutchinson, Fabreeka, Sentek Dynamics Inc., Vicoda GmbH, Isolation Technology Inc., Trelleborg AB, and Kinetics Noise Control Inc.

1 The source’s predictions were made before governments around the world shut down many businesses to slow the spread of COVID-19 in 2019 and 2020. Once the effects of the shut down are analyzed in the months to come, these predictions may change dramatically.

Geographic reference: World
Year: 2019 and 2027
Market size: $4.3 billion and $6.7 billion, respectively
Sources: “Vibration Control System Market Size, Share & Trends Analysis Report by System Type, by Application (Automotive, Manufacturers, Healthcare, Aerospace & Defense, Oil & Gas), by Region, and Segment Forecasts, 2020 – 2027,” Grand View Research Report Summary, April 2020 available online here; “Vibration Control System Market Size Worth $6.7 Billion by 2027: Grand View Research, Inc.,” CISION PR Newswire, April 23, 2020 available online here.
Image source: egon isaksson, “twilight-helicopter-himmel-1324836,” Pixabay, April 12, 2016 available online here.

Self-Checkout Systems

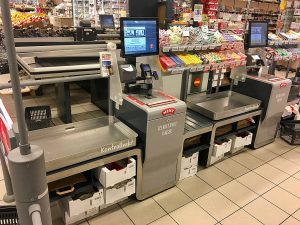
self-checkout systems

While more of us are ordering our groceries online nowadays, others of us still shop at brick-and-mortar stores. With state governments limiting the number of people in a store, including limiting the number of store personnel, more of us may be using self-checkout systems to pay for our groceries. Before the restrictions implemented to slow the spread of COVID-19, stores were experiencing an increase in customers, and with that, customers were experiencing longer wait times in checkout lines.

With the growth of e-commerce, brick-and-mortar stores are also having to compete with the ease of shopping online, customers checking out their items with the click of a mouse. The stores have a need to increase revenue while decreasing costs. Increased labor costs, a shortage of workers in developed countries, and a consumer preference for personalized shopping experiences have led retailers to install self-checkout systems. These systems allow stores to shift their personnel from the checkout lane to other retail operations such as restocking shelves and helping customers directly.

Today’s market size shows self-checkout system revenue for 2019 and projected for 2027. The systems segment of the market, the hardware itself, accounted for more than 55% of revenue in 2019. The rest comes from the services segment, which includes consulting, implementation, and maintenance services. This segment is expected to experience the fastest growth during this time period. The need for customized software and the need to update or upgrade the software will contribute to this growth.

Self-checkout systems can be cash-based or cashless. Cash-based systems, whether standalone or systems that can be mounted on a shelf, pedestal or wall, had the highest market share in 2019. Consumer preferences for cash transactions along with some cities in the United States banning cashless stores will contribute to growth in this segment. Cashless systems, like what is found in Amazon Go stores, where customers can pick a product, scan it, and pay for it in the aisle using a smartphone app, are expected to experience the fastest growth through 2027. While cash is still the most widely used form of payment in the world, growth in this segment of the industry will be due to the increasing popularity of electronic payments among millennials and middle-aged consumers in addition to the increasing availability of digital payment solutions. 

However, not all retail is conducive to cashless self-checkout systems. In 2018, Walmart abandoned a pilot program that tested the technology in many of its stores. Walmart shoppers who tried the service found it awkward to scan a large number of items and found it difficult to scan fresh produce efficiently. As a result, not many customers used this system. High inventory stores with many existing checkout stations, electronics stores which require customer service personnel to help customers with their purchases, and clothing stores in which customers try before they buy, and those same customers may not return items to the shelf or rack if they decide not to purchase them are other examples of businesses where cashless self-checkout systems may not be practical.

Although self-checkout systems may be more convenient for consumers, it also contributes to a rise in the loss rate for stores. Thefts and items not being scanned, whether deliberate or accidental, lead to an average 4% loss rate for retailers who implement self-checkout systems. Newer systems, however, use artificial intelligence to reduce fraud.

By region, North America had the highest market share followed by Europe as more large supermarkets, hypermarkets, and discount chains adopt self-checkout systems. The Asia-Pacific region is expected to be the fastest-growing region for the adoption of self-checkout systems, expanding at a compound annual growth rate of more than 15%. The adoption of cashless self-checkout systems is driving the growth, especially AI-enabled cashless systems in which all products are scanned instantly before the consumer is directed for payment. Worldwide, leading self-checkout system companies include: NCR Corp., Toshiba Global Commerce Solutions, Diebold Nixdorf Inc., FUJITSU, ITAB Group, and ECR Software Corp.

Geographic reference: World
Year: 2019 and 2027
Market size: $2.8 billion and $7.8 billion, respectively
Sources: “Self-checkout Systems Market Size, Share & Trends Analysis Report by Components (Systems, Services), by Type (Cash Based, Cashless), by Application, by Region, and Segment Forecasts, 2020 – 2027,” Grand View Research Report Summary, April 2020 available online here; “Self-checkout Systems Market Size Worth $7.8 Billion by 2027 | CAGR: 13.3%: Grand View Research, Inc.,” CISION PR Newswire Press Release, April 16, 2020 available online here; “Amazon Go Remains Compelling but Niche Shopping Experience, Finds Strategy Analytics,” BusinessWire, April 21, 2020 available online here; Russell Redmond, “Walmart Pulls Plug on Moblie Express Scan & Go,” Supermarket News, May 17, 2018 available online here; Michael Suswal, “Why Retailers are Abandoning Scan & Go Self-Checkout,” Multichannel Merchant, January 15, 2019 available online here; Paul van der Knaap, Taco de Vries, and Ewout Boesenach, “World Cash Report 2018,” G4S Cash Solutions and Payment Advisory Group, 2018 available online here.
Image source: Wolfmann, “File:Self-service check-out Barcode scanning Payment machine Grocery store (Selvbetjent kasse Skanning Betalingsautomat) Interior etc Meny Supermarket Industrivegen Osøyro Norway 2019-11-28 IMG 6048.jpg,” Wikimedia Commons, November 28, 2019 available online here. This image file is licensed under the Creative Commons Attribution-Share Alike 4.0 International license.

Marijuana Drying and Curing Equipment

In the United States, 46 states have decriminalized small amounts of marijuana, allow the use of medical marijuana, or allow the adult use of recreational marijuana. Twenty other countries also allow some form of marijuana use.1 Cultivating and harvesting marijuana plants are only two parts in the process of creating a usable product. The plants also need to be dried and cured.

The drying and curing process, if done properly, enhances the flavor and smell, inhibits mold and bacteria growth, increases the shelf-life of the product, and may increase potency. Drying and curing require precise humidity and temperature, both of which can be influenced by several factors including seasonal temperatures, elevations, barometric pressures, different cultivars, and quantities, to name a few. Some smaller processors that have only a few plants may prefer to dry and cure the product manually, using drying racks and containers for curing, while personally monitoring the environment in the drying room and checking on the progress often. Mid-size and larger processors that dry and cure several pounds of product at a time are more likely to use stand-alone drying and curing machines that automatically maintain the correct temperature and humidity within, thereby needing less oversight.

Today’s market size shows the sales of marijuana drying and curing equipment worldwide in 2017 and projected for 2025. The United States led with a 55% share in revenue in 2017, followed by Canada with 32.2%. Australia, Uruguay, Israel, and Colombia combined composed the other 12.8%. More countries are expected to legalize the use of marijuana for medical or recreational use. As a result of this and technological advances in the equipment, demand is predicted to increase.

1 As of January 2, 2018.

Geographic reference: World
Year: 2017 and 2025
Market size: $76.7 million and $157.1 million, respectively
Sources: “Marijuana Drying and Curing Equipment Market Size, Share & Trends Analysis Report By Country (U.S., Canada, Germany, Australia, Uruguay, Israel, and Colombia), and Segment Forecasts, 2019 – 2025,” Grand View Research Report Summary, January 2019 available online here; “The Global Marijuana Drying and Curing Equipment Market Size is Expected to Reach USD 157.1 Million by 2025,” Cision PR Newswire, February 18, 2019 available online here; “All of the Places in the World Where Pot Is Legal,” Kindland, June 2, 2017, updated January 2, 2018 available online here; Kenneth Morrow, “Master the Art of Drying and Curing Cannabis,” Cannibis Business Times, April 2017 available online here; Nebula Haze and Alltatup, “Complete Drying & Curing Marijuana Guide,” Grow Weed Easy, February 1, 2019 available online here; “Top Tips to Successfully Dry and Cure Your Fresh Cannabis Buds,” Royal Queen Seeds Blog, October 30, 2017 available online here; “The Drying and Curing Process,” Cann Systems available online here.
Image source: gjbmiller, “marijuana-cannabis-weed-bud-green-2174302,” Pixabay, March 27, 2017 available online here.

3D Printing

The arrival on the market of consumer level 3D printers in 2012 has brought a great deal of attention to the subject of 3D printing. In essence, 3D printing may be defined as follows: A way of making objects using a computer-driven, additive process, one layer at a time. A computer-aided design (CAD) system is used by a printer-like machine which creates thousands of cross sections of the designed object and then produces that object, in plastic or metal, layer by layer. Although the name is relatively new, the technology behind 3D printing emerged in the 1980s for use, primarily, in the manufacturing sector.

There are two distinct branches of 3D printing: (1) small-scale 3D printing, where individuals or small groups with comparatively cheap machines print plastic objects in their homes or small shops, and (2) industrial 3D printing, which is usually called additive manufacturing (AM). The current industrial applications of 3D printing (primarily the creation of models, molds and dies) are seen by many as having the potential to have a revolutionary impact on manufacturing as a whole, in part because of its replacement of more traditional machine tooling tasks.

Today’s market size is an estimated value of the 3D printer market in 2012 and a forecast as to its value within a decade. This forecast comes from a gentleman who is a founding member of a company selling 3D printers to the public, 3D Systems. His forecast may refer only to 3D printers sold for nonindustrial applications, in other words, the first of the two branches of this market, as described above.

Geographic reference: World
Year: 2012 and 2022
Market size: $500 million and $35 billion respectively.
Source: Abe Reichental in a video interview with the Financial Times, “3D Printing ‘Bigger than Internet,'” June 21, 2012, available online here. “How Will 3D Printing Impact The Manufacturing Industry?” Seeking Alpha, March 18, 2013, available online here.
Original source: 3D Systems
Posted on April 2, 2013

Musical Instruments

Manufacturer product shipments

In a recent New York Times article about leading electric guitar maker, Fender, we found the size of the retail sales figure for musical instruments in the United States. But, it made us think, what about musical instrument manufacturing in the United States? It turns out that U.S. musical instrument manufacturers are weathering the 2007–2009 recession and slow recovery since reasonably well.

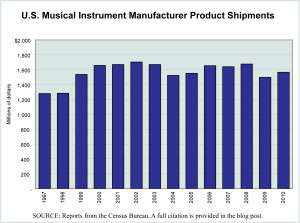
The graph presents data from the U.S. Census Bureau on musical instrument manufacturer product shipments annually from 1997 through 2010. The value of U.S. made musical instruments grew, if slightly, over this period. When compared with the value of musical instrument imports, we look at a different time period, 2000 to 2010. Over the first decade of the new century, the value of U.S. made musical instruments fell by 5.5% while the value of musical instrument imports fell 7.0%.

Today’s market size is the value of all musical instrument sales in the United States in 2011. Please note that the figures in the graphic are not retail sales, rather values based on wholesale values.

Geographic reference: United States
Year: 2011
Market size: $6.5 billion
Source: Janet Morrissey, “Aiming To Stay Plugged In,” September 30, 2012, The New York Times, page B1. The graphic was produced with data from the “Annual Survey of Manufactures: General Statistics: Statistics for Industry Groups and Industries: 2010 and 2009,” and earlier “Annual Survey of Manufacturer” reports on the industry, NAICS 339992 Musical Instrument Manufacturing. The Census Bureau data are available online through their American FactFinder website, here.
Original source: Music Trades
Posted on October 9, 2012

Computers in the U.S.

The steady rise in demand for computers and electronic computing devices in the United States appears, when charted, as a line moving in exactly the opposite direction as the domestic production and shipments of these same products. This is an industry (NAICS 334111) that highlights a trend towards increasing consumption of a product and declining production of the same which feeds the U.S. trade imbalance. But that leads us to complex questions we don’t really want to address here. Here, we present market sizes and today’s is based on the value of Electronic Computer Manufacturing in the United States in 2000 and 2010 as well as the value of net imports of the same products in 2000 and the forecasted value for 2010.

Geographic reference: United States
Year: 2000 and 2010
Market size: U.S. manufacturing $69.3 and $27.9 billion
Market size: Net imports $89.4 and $199.3 billion
Source: Computer value of shipments from Annual Survey of Manufactures 1997, and the 2002 Economic Census. Net imports of Electric and Electronic Equipment from Statistical Abstract of the United States: 2000. Net imports of Computers and Electronic Products from Statistical Abstract of the United States: 2012.
Posted on November 29, 2011

Bottom-Mounted Freezer Refrigerators

Trends in refrigerator design do not change in significant ways very often. Most changes in recent years have been related to the energy efficiency of these appliances. But one very visible design change that has become popular in the last half decade is the placement of the freezer section below the refrigerator section of the machine. These newly designed refrigerators are called bottom-mounted freezer style refrigerators. Many of these machines, though not all, use a large pull out drawer to hold the freezer section instead of a compartment entered through a simple door.

Today’s market size is an estimated size of this market for bottom-mounted freezer refrigerators in North America.

Geographic reference: North America
Year: 2010
Market size: $3 billion
Source: “UPDATE: Whirlpool Petitions US for Trade Probe on Samsung, LG,” ADVFN, March 30, 2011, available online here.
Original source: Dow Jones News and Whirlpool Corp.
Posted on October 6, 2011

Pinball Machines

Pinball was a popular form of entertainment in the 1970s through the early 1990s. During this time period, there were five different companies producing 100,000 machines per year. Since then, video games have replaced pinball as a popular pastime. Many businesses such as arcades and bars, where pinball machines were commonplace, saw reduced revenue and decided to get rid of the machines and replace them with video games.

In 2011, Stern Pinball, based in Chicago, Illinois, was the only remaining pinball manufacturer in the world. From 1999 to 2009, the number of pinball machines in commercial locations dropped from 360,000 to 79,000. Data show pinball industry revenues in 1999 and 2009.

Geographic reference: United States
Year: 1999 and 2009
Market Size: $1.1 billion and $275 million respectively
Source: Olivia Oran, “Pinball Fights to Survive in an ‘Angry Birds’ World,” The Street, September 19, 2011, available online here.
Original source: Vending Times
Posted on September 23, 2011