Angel Investors

angel investors for startups
Geographic reference: United States
Year: All of 2020 and the first half of 2021
Market size: $2.6 billion and $2.1 billion, respectively

Not too long ago, budding entrepreneurs with a new, innovative product or service would look to a handful of wealthy investors to fund their business ventures. Because of the riskiness of investing in startups — an overwhelming majority of startups fail, with more than a fifth failing in their first year — Securities and Exchange Commission (SEC) rules restricted investments into such ventures. Accredited investors, those that were allowed to invest in startups, were limited to persons who had an income over $200,000 ($300,000 joint income), had a net worth of greater than $1 million, or be a general partner, executive officer, or director for the startup company. Startups also preferred to deal with a small number of large investors rather than spend time processing a large number of small checks.

But, this has changed for some. New technological tools, such as crowdfunding websites, make fundraising from a large number of small investors easier. And, on August 26, 2020, the SEC began allowing less wealthy investors to become accredited. Now, SEC rules allow “persons to qualify as accredited investors based on certain professional certifications, designations or credentials or other credentials issued by an accredited educational institution.” However they qualify to become accredited, angel investors provide financial backing for small startups or entrepreneurs in exchange for ownership equity or convertible debt, the term “angel” coming from the Broadway theater when wealthy patrons would give money to produce theatrical productions. Today’s market size shows the total amount angel investors invested in startups in 2020 and in the first half of 2021 in the United States. 

In 2020, there were 2,725 new angel investors. This number is expected to exceed 3,000 in 2021. Most new angel investors have ties to the tech industry, but they are outsiders in the world of venture capitalists. Others come from various walks of life including doctors, dentists, art curators, professional poker players, influencers, and retirees among others. The angel investor boom is part of the larger trend of investors seeking out riskier investments in recent years. Some are taking on these riskier investments because they have extra cash to invest and want a higher rate of return than what’s offered on traditional investments. Many are investing in tech startups, seeing the high profits companies in this sector are generating. Others are motivated by causes they believe in or want to give a hand up to those generally overlooked by traditional venture capitalists, like minority and women entrepreneurs. Less than 2% of venture capital funding goes to women-founded businesses.

While accepting the risk, most of these smaller investors are not going into this venture blindly. In addition to listening to investment podcasts and reading news articles, investors have at their disposal a range of companies that offer angel investor resources to help them navigate this type of investing. For example, companies such as Angel Squad, Seed Spot, and VC Academy, among others, provide training courses for would-be angel investors. Pipeline Angels, Launchpad Venture Group, TBDAngels, and Golden Seeds are just a few of the groups that angel investors can join to lessen individual investment risk. Generally, investors who join groups don’t have to put as much money down as individual investors do, although this varies by group. Also, by being a part of a group an investor does not have to seek out and vet deals independently. Some groups decide to invest in ventures as a group, writing one check; others allow individual investors to make their own decisions. Many angel groups are centered around a certain industry or have certain requirements for the type of company in which they will invest. For example, some groups will only invest in clean energy companies, while others will only invest in BIPOC-founded companies. Some groups invest only in local companies while others work with all companies. Some of the most successful angel investors of 2020 included Fabrice Grinda, Paul Buchheit, Esther Dyson, Alexis Ohanian, and Scott Banister. Fabrice Grinda was named the top angel investor in the world by Forbes. Although it varies by angel and angel group, companies typically raise between $250,000 and $500,000 through angel investors, and those investors generally aim to recoup their investment within 3 to 5 years. Due to their risky nature, angel investments commonly represent 10% or less of an angel investor’s portfolio.

Original sources: National Venture Capital Association and PitchBook.
Sources: Erin Griffith, “Even Your Allergist is Investing in Startups,” The Denver Post, reprinted from The New York Times, September 12, 2021, p. 3K; Sean Bryant, “How Many Startups Fail and Why?” Investopedia, November 9, 2020 available online here; Veronica, “Founders + Funders: Angel Investing Advice and Resources,” Medium, February 17, 2021 available online here; “SEC Modernizes the Accredited Investor Definition,” Securities and Exchange Commission Press Release, August 26, 2020 available online here; Akhilesh Ganti, “Angel Investor,” Investopedia, July 26, 2020 available online here; Adam Hayes, “Accredited Investor,” Investopedia, August 25, 2021 available online here; “Angel Investor Training,” Seed Spot available online here; “VC Angel Investor Program,” VC Academy available online here; Dylan Taylor, “The Top 5 Angel Investors,” Morgan Brooks Capital, December 18, 2020 available online here.
Image source: Markus Winkler, “White and Black Typewriter on White Table,” Unsplash, June 7, 2020 available online here.

SPACs, The Newest Investment Craze

Click on the graph to see full size image.
Geographic reference: World
Year: 2015 and 2020
Market size: based on market capitalization — $3.902 billion and $83.341 billion, respectively

What are SPACs? The acronym stands for special-purpose acquisition companies and they are what is also known in the investment world as “blank check” companies or shell companies listed on the stock exchange with the sole purpose of acquiring private companies wishing to go public. A SPAC provides an investment vehicle for a group of investors (and/or private equity firms) and can provide a private company that merges with it a means of going public without having to go through an initial public offering (IPO) process.

While SPACs have existed since 1993—when the first one was created by the investment bank GKN Securities as a means of skirting the then prohibition to blank check companies on the U.S. Stock Exchange—they have only recently risen to prominence with blue-chip investors and become fashionable investment vehicles. Worth noting, the first SPAC listed in Europe, on the Euronext Amsterdam exchange, was Pan-European Hotel Acquisition Company N.V. in 2007.

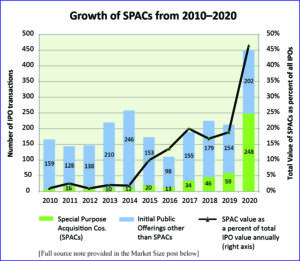
As the chart above shows, SPACs grew from representing 1 percent of the value of all U.S. IPOs in 2010 to representing nearly half (46.5%) in 2020, and in terms of the number of transactions, SPACs exceeded half in 2020, reaching 55 percent of all new entrants to the U.S. Stock Exchange. More than $80 billion were invested in SPACs in 2020 compared with $13.6 billion the year before. During the first two months of 2021 alone, another $77 billion came into the market through the formation of new SPACs.

All this activity has drawn attention. Short sellers, who bet against a stock’s performance, began in 2021 to target SPACs more heavily. This combined with anticipated increased scrutiny of SPACs by the incoming Biden Administration’s new Securities and Exchange Commission (SEC) Chairman, Gary Gensler suggests that the recent surge in the SPAC market will cool. But, as of the middle of March money is still pouring into SPACs every day, to the tune of millions of dollars a day, something easily monitored at this Stock Market MBA website.

Sources: Mike Bellin, IPO Services Co-Leader, PwC US, “Why Companies are Joining the SPAC Boom,” PwC United States, published on September 22, 2020 and available online here; Matt Wirz and Juliet Chung, “Short Sellers Target SPACs,” The Wall Street Journal, March 15, 2021, page 1.
Image source: Graph was produced in-house with data keyed from the website of SPAC Investments Ltd. on March 15, 2021 available online here.

Fine Art Market

Today we look at the global trade in fine art. This market is measured by looking at sales through public auctions as well as industry estimates of art gallery and private art dealer sales based on polls of over 6,500 dealers around the world. While the market in 2015 was down by 7% from 2014, the United State’s portion of the market grew, reaching 43% of the total. This is because the United States saw increases in fine art sales from both 2013 to 2014 and again from 2014 to 2015 while global fine art sales were dropping.

Globally, the market became more top heavy in 2015 with a rise in ultra-high-end transactions, those valued at over $10 million each. This portion of the fine art market accounted for 28% of the total in 2015.

Geographic reference: World
Year: 2015
Market size: $63.8 billion
Source: Alexander Forbes, “The 10 Most Important Takeaways from the 2016 TEFAF Art Market Report,” Artsy Editorial, March 11, 2016, available online here
Original source: The European Fine Art Foundation (TEFAF) 2016 Art Market Report

Student Loan Debt

Today’s market size is the amount owed in the United States for loans taken to finance higher education. The figures, which come from reports produced by the Federal Reserve Banking system, appear in an interesting article about the opportunity costs of having a large part of the younger generation beginning its productive life carrying a significant debt load. This fact may begin to explain the decline in first-time home purchases as well as declining numbers of new business start-up, two activities that require a population with more debt capacity than young people in the United Sates have these days.

Geographic reference: United States
Year: 2003 and 2013
Market size: $300 billion and $1.1 trillion respectively
Source: Phyllis Korkki, “Ripple Effects From Rising Student Debt,” The New York Times, May 25, 2014, pages B6.
Original source: Professor Brent W. Ambrose of Pennsylvania State University and Larry Cordell and Shuwei Ma of the Federal Reserve Bank of Philadelphia.
Posted on May 30, 2014

Catastrophe Bonds

Catastrophe bonds, or cat bonds, are bonds sold by an entity wishing to reduce its liability in the face of catastrophic losses such as the ones being caused by the seemingly increasingly violent natural storms occurring around the world. The market for cat bonds has been strong and growing as both the need for risk mitigation has risen as have the number of large investors searching for lucrative investment opportunities in an era of low interest rates.

An example of a cat bond is one issued by New York City’s transit authority in the aftermath of Superstorm Sandy. When insurance carriers, reeling from the costs associated with that storm, hesitated to underwrite the risk of future water surges, the transit authority issued a catastrophe bond in the amount of $200 million. The money will be used to repair damage to the subway system in the event of another flooding storm that reaches the same levels as Sandy within the next three years. If there is no serious storm within that period of time, the money will be returned to investors with an interest payment that—in 2012 for cat bonds—was running at 11% over the rate for Treasury Bills.

Today’s market size is the total value of catastrophe bonds outstanding as of October 1, 2013, worldwide.

Geographic reference: World
Year: 2013
Market size: $19 billion (up from $4 billion a decade ago)
Source: “Perilous Paper,” The Economist, October 5, 2013, pages 76-77.
Original source: Swiss Re Capital Markets
Posted on November 20, 2013

Public Pensions

Large pension plans have been struggling, in a period of very low interest rates since the financial crisis of 2008, to balance their asset allocation in such a way as to maximize returns. Assumptions have been made for many years now about what the average return on investment should be for public pension funds. The money going into these pension funds has been calculated accordingly. But, it turns out that the assumed annual rates of return (between 7% and 8%) have been quite optimistic. If the funds do not generate the anticipated annual returns, then more must be put into them if they are to meet their obligations to retirees. Over the ten year period 2002–2012, the public pension plans run by U.S. states have had an average annual rate of return of 6.4%.

Today’s market size is the value of all public pension assets in the United States in 2012.

Geographic reference: United States
Year: 2012
Market size: $2.6 trillion, approximately 16% of the total of all assets allocated for pensions, public and private, not including Social Security System funds
Sources: (1) Gretchen Morgenson, “How You Can Pay Millions and Lag Behind the Market,” The New York Times, October 20, 2013, B1. (2) Cliffwater 2013 Report on State Pension Performance and Trends, July 22, 2013, available here.
Original source: Cliffwater and data filed by each state in what is known as the Comprehensive Annual Financial Report (CAFR)
Posted on October 21, 2013

Detroit Housing Stock

Much has been written in the national press about Detroit over the last week and in the wake of that city’s filing for bankruptcy protection on July 18th. The debates about how the situation was allowed to get so bad and what is to be done now have been lively. For those of us who live in the shadow of this once great city, none of this is new. These debates have raged here for years, and the march to insolvency has been a long one, like a Greek tragedy playing out in slow motion. It is the true scope of the challenge that is difficult for those not familiar with Detroit to fully understand.

Today’s market size post is the size of the housing market in the City of Detroit, more specifically, the total number of housing units in that city. The figure provided includes housing units that are not habitable. In fact, when one calculates the percentage of housing units in Detroit that are actually occupied the number is only around 20%. To further place this housing stock figure into context, the population of the city is also provided below as is the median sale price of a home in Detroit.

Geographic reference: Detroit
Year: 2011
Market size: Housing Units: 1,886,537
Market size: Population: 701,500 (2012)
Market size: Median Home Sale Price: $9,568 (in May of 2013 this median price had risen to $11,100)
Source: [1] “Detroit (city), Michigan,” State and County QuickFacts, a presentation of current U.S. Census data originally made available online here. For updated Census data, see the Further reading section below. [2] JC Reindl, “Chapter 9 Unlikely to Hurt Home Prices,” Detroit Free Press, July 21, 2013, page B1. [3] Charles B. Stockdale, Douglas A. McIntyre and Michael B. Sauter “American’s Ten Sickest Housing Markets,” NBCNews.com, August 5, 2011, available online here.
Original source: U.S. Census Bureau, S&P/Case-Shiller and Realcomp
Further reading: “Selected: Detroit city, Michigan; Michigan,” Quick Facts, U.S. Census Bureau available online here; “Detroit city, Michigan,” American FactFinder, U.S. Census Bureau available online here; “Detroit, MI Schools,” AreaVibes available online here.
Posted on July 23, 2013

Venture Capital for Clean Technology

Clean technology is a somewhat ambiguous term but one heard more and more often today. According to Clean Edge, a research firm specializing in the study of this sector, clean technology refers to a diverse range of products, services, and processes that make use of renewable materials and energy, strive to use fewer natural resources, and to reduce emissions and wastes in both the process of their production and their use. Such companies may be in fields like renewable energy, electric motors, green chemistry, water use management, public transportation, sustainable agriculture, and areas of information technology specifically aimed at helping to reduce or eliminate emissions and waste in any number of processes.

Today’s market size is the amount invested by venture capital firms around the world in clean technology endeavors. The amounts for both 2011 and 2012 are shown. Clear from these data is that investment in such endeavors fluctuates greatly from year to year, despite the seeming relentless admiration for such clean technologies in the media at large. The New York Times article from which this market size comes (a link to which is provided below) tells an interesting story about how one company is using niche market products to help bridge the gap between proof of concept and small scale production to high volume production, a gap often referred to in the industry as Death Valley.

Geographic reference: World
Year: 2011 and 2012
Market size: $9.6 billion and $7.4 billion respectively
Source: Diane Cardwell, “A Side Trip on the Road to Clean Fuel,” The New York Times, June 23, 2013, page B1, and available online here.
Original Source: Cleantech Group’s i3 Platform
Posted on June 24, 2013

Gold Demand

Gold demand trends worldwide, 1992-2012

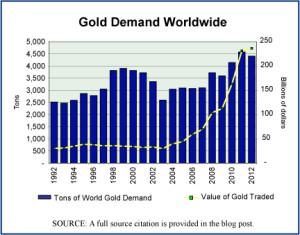
The sharp rise in the price of gold since 2007 is a sign of how uncertain the financial world feels to many people since it went through a serious crisis in 2008. Although the United States abandoned the gold standard in 1933—thus severing the direct convertibility of the U.S. dollar for a set weight and quality of gold—gold is still seen as one of the precious metals that will hold its value during deflationary times or times when other investments are risky. The trade in gold tends to rise during uncertain times as does the price of gold. The annual average price of gold rose during the first decade of the century by 340%, from $279.1 per troy ounce to $1,224.5.

Today’s market size is the volume and value of gold traded in 2000 and in 2012. The graph shows what the global demand for gold has done annually over the period 1992–2012. The increased demand in the last few years has been large but not nearly as large as the rise in the price of gold.

Geographic reference: World
Year: 2000 and 2012
Market size: 3,818 tons valued at $34.26 billion and 4,405 tons valued at $236.40 billion respectively
Source: “Gold Demand Trends, Full Year 2012,” February 2013, World Gold Council, available online here. The graph was produced with data from this same report, as well as the earlier editions of the same, from 1996 and 2005, both of which are available on the same WGC website cited above.
Original source: LBMA, Thomson Reuters GFMS, and World Gold Council
Posted on February 28, 2013

Classic Cars

Concours d'Elegance, summer 2011, Michigan

The market for classic cars has been very strong over the last two decades in the United States. It is one of the niche markets used by the well-heeled as both an investment vehicle and a hobby. Today’s market size is the approximate value of classic car auction sale totals in 1995 and 2011.

Geographic reference: United States
Year: 1995 and 2011
Market size: $45 million and $500 million respectively
Source: Scott Rosenblatt, “Total Auction Sales,” Classic Cars: Your Portfolio’s Midlife Crisis, Credit Suisse, 2012, page 21, available online here.
Original source: Classic Car Auction Yearbook (data Historica Selecta)
Posted on October 23, 2012

Financial Information

The market for financial information can be defined in many ways. Most often it is understood to be the market used by investors who wish to study the stock market with an eye on decisions related to whether to invest in, and when to invest in, a particular company’s stock, a fund of stocks, or a particular industrial sector. The leaders in the field of financial information are Thomson Reuters and Bloomberg. Today’s market size is the estimated total worldwide of money spent on financial information in 2008.

Geographic reference: World
Year: 2008
Market size: $23.01 billion
Source: “Burton-Taylor Data Indicates Challenging Year for Thomson Reuters, Bloomberg and Financial Information/Analysis Market,” Press Release dated February 18, 2009 and available online here.
Original source: Burton-Taylor International Consulting L.L.C.

Gold Bars

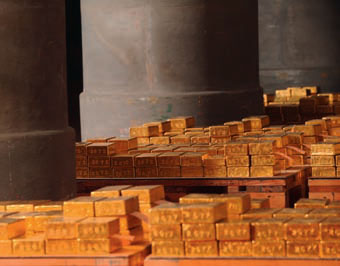
A National Geographic journalist, while on assignment for the journal, was given a tour of the vast Paris underground, a maze of structures excavated over the years at various levels under the surface of the Earth. Gold Bars It consists of old crypts, used and unused sewer lines, metro train tunnels, the empty quarries from which much of the stone used to build the city was extracted, and heavily fortified vaults under banks and museums. The journalist and author of the source article, Neil Shae, and his colleague, photographer, Stephen Alvarez, were taken into the vault under the Banque de France and shown the French national gold reserves which are kept there in piles and piles of gold bars, each valued at around $500,000.

Geographic reference: France
Year: 2010
Market size: Approximately 2,600 tons.
Based on the price of gold on the international market on January 28, 2011, the approximate value of the gold bars under the Banque de France is $120.1 billion.
Source: “Under Paris,” National Geographic, February 2011, page 124. The image of gold bars we use here comes from a Banque de France Annual Report, available online here.
Original source: Banque de France

Small Hedge Fund Market

The global financial crisis that started in 2008 has had enormous ramifications of many sorts. Not surprisingly the financial sector itself has seen quite a lot of restructuring in the period since then. One area of great change has been the number of small hedge funds in existence. According to a New York Times article on the subject, many such funds are being closed down so as to eliminate their recent history of returns, or, more accurately, lack thereof. Then, the same people behind these funds simply open new funds with a clear record. Clearly this does not occur with most such small hedge funds since their numbers have fallen by 30% (and assets under management by approximately 21.5%) since peaking in number in 2007.

Geographic reference: World
Year: 2007 and 2010
Market size: 12,000 and 8,400 funds respectively
Source: “Hedge Fund Managers Set Up for New Act,” The New York Times, September 17, 2010, page B1 available online here.
Original source: Heidrick & Struggles