Waste & Scrap Exports

U.S. Waste Exports 2000-2011

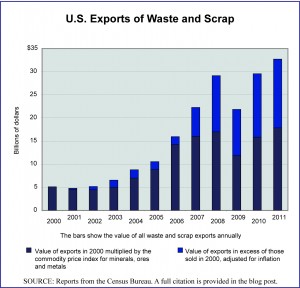
With the growth of globalization and the increased demand on raw materials, the prices of basic commodities such as minerals, metals, wood, and paper have been volatile and have risen sharply since 2000. This has stimulated the trade in reusable waste and scrap materials, including international trade. Today’s market size is the value of all waste and scrap material exported from the United States in 2000 and in 2011.

The graph presents these data as well as the figures for the intervening years. It also shows by a differentiation in color on each bar the approximate share of the increased export value that is attributable to rising commodity prices and the share that is the result of actual increased volume. The dark blue portion of each bar is the value of exports in 2000 multiplied by the international commodity price index for minerals, ores and metals. (Please note that the Waste & Scrap category as a whole includes more than just minerals, ores and metals—although they do dominate the trade—therefore this calculation provides only an approximation). The lighter blue portion of each bar is the value of exports in excess of the inflation-adjusted value of exports in the year 2000.

Geographic reference: United States
Year: 2000 and 2011
Market size: $5.12 and $32.74 billion respectively
Source: “U.S. International Trade Statistics,” (910 Waste and Scrap), a searchable database presented by the Census Bureau and availalble online here. The commodity price index data used to calculate the inflation adjusted value of the 2000 exports is from “Free Market Commodity Price Indices, 1960–2011,” a report from the United National Conference on Trade and Development available online here.
Original source: U.S. Department of Commerce, Bureau of the Census and the UNCTAD
Posted on September 24, 2012

Cement in Spain

Spanish Cement Consumption

We hear much these days about Europe and the economic struggles it is having. Watching from afar—or at least as far as one can be in our very intertwined, economically globalized world—we tend to see primarily the outlines of the big, macro picture. A quick glance at Spanish cement demand since 2007 reminds one of how the overall downturn is hitting some sectors with special ferocity.

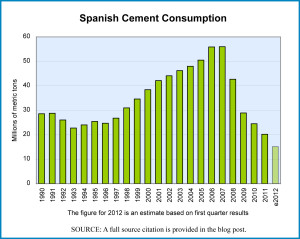
While many industrialized nations experienced a construction boom during the 2001-2007 period, Spain’s was one of the larger. Consequently, its cement industry grew at a robust rate for a decade. Since peaking in 2007 it has shrunk dramatically and significant declines in early 2012, on a year-over-year basis, suggest that the shrinking is far from complete. In fact, rates of consumption when measured on a per capita basis have not been as low in Spain since 1966.

Today’s market size post shows the demand for cement in Spain in 2007 and 2011. The graph shows Spanish cement consumption over a two decade period.

Geographic reference: Spain
Year: 2007 and 2011
Market size: 56.0 and 20.2 million metric tons respectively
Source: “Holcim Spain to Cut 35% of Workforce,” Global Cement, May 23, 2012, available online here. and updates from the Monthly Retail Trade Reports from the same reporting series, U.S. Census Bureau, available online here. The graph was created from data provided by Oficemen, the Spanish Cement industry association, Agrupación de Fabricantes de Cemento de España, available online here.
Original source: Global Cement and Oficemen
Posted on May 25, 2012

Solar Panels

On May 17, 2012, the U.S. Commerce Department announced the imposition of antidumping tariffs on solar panels imported to the United States from several Chinese companies. China exports 95% of the solar panels it makes worldwide. In the United States, Chinese-made solar cell imports more than doubled between 2010 and 2011 while the wholesale price of solar cells in the United States continued a multi-year fall. The price of solar panels is based on their electrical capacity. In 2008, the average price per watt of capacity was $3.30 and in January 2012 that price had fallen to $1.20. The lower prices have fueled the market and led to quickly rising installations but they have also crippled the domestic panel manufacturing industry. Therefore, the new tariffs are welcomed by one part of the industry—manufacturers—and disliked by another—installers.

Today’s market size is the value of solar cells imported to the United States from China in 2011.

Geographic reference: United States
Year: 2011
Market size: $3.1 billion
Source: Keith Bradsher and Diane Cardwell, “Chinese Solar Panels Face Big Tariffs,” New York Times, May 18, 2012, page B1, available online here. Also from Keith Bradsher, “U.S. Solar Panel Makers Say China Violated Trade Rules,” New York Times, October 19, 2011, available here.
Original source: U.S. Department of Commerce
Posted on May 22, 2012

Dolls, Games, and Toys

The United States is the largest toy and game market in the world, with an estimated retail sales value in 2010 of $22 billion. This estimated value includes video game consoles but does not include the games themselves, which are categorized as software but by some estimates would add another $10 billion to the actual value of the dolls, games, and toys market. Of course, if we included things that somebody considered a toy while another considered a vehicle of some sort—boat, bike, snowmobile—it would be an even larger market… Yes, defining the market is key, which is part of what makes a system like the North American Industrial Classification System (NAICS)—used by Canada, Mexico, and the United States—so useful.

Today’s market size post breaks the U.S. dolls, games, and toys industry down into three categories, U.S. manufacturer shipments, imports, and exports. The fact that U.S. made product is valued by the Census Bureau at less the value of exports is the result of what is called re-exportation; some of what is imported is turned right around and exported. A topic for another day.

Geographic reference: United States
Year: 2002 and 2010
Market size: Domestic production at wholesale: $4.85 and $2.86 billion
Market size: Exports F.A.S.: $1.16 and $3.77 billion
Market size: Imports C.I.F.: $12.06 and $22.30 billion
Source: “Statistics for Industry Groups and Industries: 2010 and 2009,” Annual Survey of Manufactures 2010, available from the Census Bureau website here. and data from the U.S. International Trade Statistics database on NAICS industry 339932. The International Trade Statistics database is available online here.
Original source: U.S. Department of Commerce, Bureau of the Census
Posted on May 5, 2012

Syrian Import Market

For our market size post today we turn to the newest edition of an important yearly statistical compilation put out by the United Nations. The work is cited fully in the source note below. Data for most countries are provided through last year in the 2010 International Trade Statistics Yearbook, but the data for Syria only extend through 2009 and due to the serious political upheaval going on there now it is unlikely that reliable statistics will be available from Syria in the near future.

Today’s market size is the size of the Syrian market for imports. Over the last decade (2000-2009), Syria saw the value of its imports rise by 180%. The value of its exports also rose but by a smaller percentage (126%) leading to a negative balance of payments in 2009.

Geographic reference: Syria
Year: 2009
Market size: $15.44 Billion
Source: “Total Imports and Exports by Regions and Countries or Areas (Table A)”, 2010 International Trade Statistics Yearbook, Vol. 1—Trade by Country, June 16, 2011, available online here.
Posted on December 13, 2011

Foreign Students in the United States

While within the United States there is a great deal of debate about how the higher education system as a whole is functioning, its appeal to those from outside the country is as strong as ever. The number of students traveling from outside the United States to attend a U.S. institute of higher learning has been increasing steadily during the first decade of the 21st century. This is both a challenge and a benefit for U.S. colleges and universities as these students often need intensive language assistance but also pay full tuition. According to the U.S. Department of Commerce, foreign students in the United States contribute approximately $20 billion to the economy annually.

Today’s market size is the size of the population of foreign students at U.S. institutions of higher learning in 2009.

Geographic reference: United States
Year: 2009/2010 School Year
Market size: 690,923 students — in terms of country of origin, the three leading countries are China which sent 18.5% of the students in 2009/2010, India which sent 15.2% and South Korea which sent 10.4%
Source: A press release for the report titled Open Doors 2010 which is put out annually by the Institute of International Education. The report is issued annually and the press release announcing the 2010 edition is available online here.
Original source: Institute for International Education and the U.S. Department of State’s Bureau of Educational and Cultural Affairs
Posted on November 7, 2011

Air Travel Globally

Despite the dramatic declines in air travel for several years following the terrorist attacks in 2001, over the last decade, humans have been flying more and more. Worldwide, approximately 513 million passengers traveled by air in 1991 and by 2007 that figure had quadrupled, reaching 2,076 million.

Today’s market size is the value of the global airline business in 2007 and a forecast of the value in the year 2012. What is not evident from these revenue based figures is the fact that airlines, despite their growth, have not added up to a profitable business sector. In fact, since deregulation in the United States in 1978, airlines as a whole have lost money.

Geographic reference: World
Year: Forecast for 2007 and forecast for 2012
Market size: $430 billion and $711 billion respectively
Source: “The Global Airline Industry Will Reach a Value of $711 Billion in 2012, Forecasts New Report,” a press release dated March 14, 2009, announcing the publication of a market report being offered through a web service called “Report Buyer.” The press release is available here. The original report is titled Airlines: Global Industry Guide.
Original source: Datamonitor
Posted on September 16, 2011

Spanish Import Market

The newest edition of an important yearly statistical compilation was released recently by the United Nations. The work is listed fully in the source note below.

Today’s market size is the size of the Spanish market for those exporting to Spain, thus, the size of the Spanish market for imports. Over the last decade (2000-2010), Spain saw the value of its imports rise by 106.4% and saw the value of its exports rise even more quickly (238%).

Geographic reference: Spain
Year: 2010
Market size: $315.55 Billion
Source: “Total Imports and Exports by Regions and Countries or Areas (Table A)”, 2010 International Trade Statistics Yearbook, Vol. 1—Trade by Country, June 16, 2011, available online here.

Beauty Products from France

The newest edition of an important yearly statistical compilation was released recently by the United Nations. Among the things this work provides is a detailed, country-by-country report on exports and imports.

Today’s market size is the value of all beauty or make-up products exported from France in 2008—the peak year in the decade— 2009, and 2010.

Geographic reference: France
Year: 2008, 2009 and 2010
Market size: $6,508; $5,533 and $6,047 million respectively
Source: “International Merchandise Trade Statistics,” Yearbook 2010, report on France, a link to which is available here.
Original source: United Nations

Sporting Equipment — Chinese Exports

The first decade of the 21st century has been one marked by the rapid increase in globalization. As we saw in an earlier market size post, here, world trade increased some 133% between 2000 and 2010. China’s role in this rapidly growing market has increased over this same period from representing 4% of the total world exports in 2000 to 10.7% of the much larger total in 2010, producing a 533% increase in international trade for China over this decade.

Today’s market size is the estimated total value of Chinese export sales of sporting equipment based on export sales for the first six months of 2010 which totaled $2.5 billion.

Geographic reference: China
Year: 2010
Market size: $4 billion
Source: Sporting Equipment, Essential Sourcing Intelligence for Buyers, published September 2010, one in a series of reports called China Sourcing Reports, a sample of which is available online here.
Original source: Global Source

Hungarian Import Market

The newest edition of an important statistical compilation produced annually was released recently by the United Nations. The work is listed fully in the source note below.

Today’s market size is the size of the Hungarian market for those exporting to Hungary, thus, the size of the Hungarian market for imports. Over the last decade, Hungary saw the value of its imports rise by 174% but saw exports rise even more (238%) producing a positive trade balance for the nation in 2010.

Geographic reference: Hungary
Year: 2010
Market size: $87,612 million
Source: “Total Imports and Exports by Regions and Countries or Areas (TableA)”, 2010 International Trade Statistics Yearbook, Vol. 1—Trade by Country, June 16, 2011, available online here.
Original source: United Nations, International Merchandise Trade Statistics Section

World Trade

The newest edition of an important yearly statistical compilation was released recently by the United Nations. The work is listed fully in the source note below. The statistics in this work help quantify the term globalization, so often heard but not, perhaps, fully understood for the transformative impact that it is having on world trade.

Today’s market size is the size of all exports worldwide as valued in dollars. Total exports in 2000, as well as 2010, are provided and the 133% increase is noteworthy. The peak year in this decade was 2008.

Geographic reference: World
Year: 2000 and 2010
Market size: $6,337,820 and $14,784,130 million respectively
Source: “World Exports by Provenance and Destination (TableD)”, 2010 International Trade Statistics Yearbook, Vol. 1—Trade by Country, June 16, 2011, available online here.

Coffee

Today’s market size offers a measure of the world’s coffee production. The U.S. Department of Agriculture tracks many, many agricultural products, geographically, by output, by shipment and even by consumption. Another example of how the Federal government’s data collection agencies provide us with an extremely valuable service.

Happy tax day!

Geographic reference: World
Year: 2000-2001 and 2010-2011
Market size: 117,521 and 139,084 thousand 60-kilogram bags respectively
Source: “Table 01 – Coffee World Production, Supply and Distribution,” Coffee: World
Markets and Trade,
December 2010, page 4, available online here.
Original source: U.S. Department of Agriculture, Foreign Agricultural Service

Fresh Vegetables, Exports & Imports

Today’s market sizes are the value of fresh fruit exported from and imported into the United States. Two year’s worth of import and export figures are provided. The export values are based on free alongside ship (FAS) values at the U.S. port of exportation while the import values are based on customs value at the U.S. port of entry.

Geographic reference: United States
Year: 2010 and 2020
Market size: Exports: $2,060 and $2,791 million respectively
Market size: Imports: $5,180 and $8,985 million respectively
Source: “Table 29. Horticultural Crops Long-Term Export and Import Projections, Fiscal Years,” USDA Agricultural Projections to 2020, February 2011, page 80, available online here.
Original source: U.S. Department of Agriculture, Interagency Agricultural Projections Committee, and the U.S. Department of Commerce, Bureau of the Census

Fresh Fruit, Exports & Imports

Today’s market sizes are the value of fresh fruit exported from and imported into the United States. Two year’s worth of import and export figures are provided. The export values are based on free alongside ship (FAS) values at the U.S. port of exportation while the import values are based on customs values at the U.S. port of entry.

Geographic reference: United States
Year: 2010 and 2020
Market size: Exports: $3,799 and $5,684 million respectively
Market size: Imports: $6,803 and $11,190 million respectively
Source: “Table 29. Horticultural Crops Long-Term Export and Import Projections, Fiscal Years,” USDA Agricultural Projections to 2020, February 2011, page 80, available online here.
Original source: U.S. Department of Agriculture, Interagency Agricultural Projections Committee, and the U.S. Department of Commerce, Bureau of the Census

Trade in Corn

The United States has long been the world’s leader in the production of corn for export. This trend is expected to continue although the percentage of total corn exports coming out of the United States is projected to fall from 54.5% in 2009-2010 to 52.7% in the growing season 2020-2021. This projection is one among many presented in a report titled USDA Agricultural Projections to 2020. In-depth reports such as this one are being put out regularly by the Federal government’s many agencies.

Today’s market size post is a measure of the corn exported in 2010 and projected exports worldwide in 2020.

Geographic reference: United States and World
Year: 2010 and 2020
Market size: United States: 49.5 and 59.7 million metric tons respectively
Market size: World: 93.1 and 113.2 million metric tons respectively
Source: “Table 5. Corn Trade Long-Term Projections,” USDA Agricultural Projections to
2020,
February 2011, page 49, available online here.
Original source: U.S. Department of Agriculture, Interagency Agricultural Projections Committee