Geographic reference: World Year: 2020 and 2028 Market size: $70.38 billion and $101.88 billion, respectively
Clean air and clean water. Two essentials for life on earth. In many ways, the use of filters is necessary for achieving this. Today’s market size shows total global revenues for filters in 2020 and projected for 2028. Growing concerns about reducing emissions from automotive and industrial applications as well as the increasing popularity of air and water purifiers among consumers will fuel demand for filters over this time period.
By application, motor vehicles garnered more than 47% of the market in 2020, followed by consumer goods, utilities, industrial and manufacturing, and others. Increasing automotive production, especially in China, Indonesia, South Korea, Japan, Malaysia, and Taiwan along with stringent regulations aimed at reducing automotive pollution will create increased demand for automotive filters. Filters are used in several motor vehicle applications: oil intake, air filtration, and emission filtration. Filters for internal combustion engines accounted for more than 40% of the market in 2020.
Fluid filter demand will increase due to the increased construction of water treatment plants globally. Fluid filters are also used in cold sterilization of beverages and pharmaceuticals, petroleum refining, dairy processing, and wine production. Air filters are expected to experience the fastest revenue growth through 2028 due to governments mandating the reduction of pollutants from vehicle emissions and the growing popularity of air purifiers that kill harmful bacteria and viruses in homes, hotels, airplanes, and train compartments. Demand for filters in the industrial and manufacturing sectors will center around Europe, North America, and the emerging industrialized regions of India, South Africa, Brazil, Thailand, and Indonesia.
The Asia-Pacific region held a 42% revenue share in 2020 due to the rapid industrialization in the region. The increasing pollution levels are leading governments to impose environmental quality regulations. As a result, demand for air and water filtration devices is expected to grow. In Europe, the rising demand for air filtration equipment in industries such as cement, chemicals, and metallurgy along with increasing adoption of air purifiers in Germany, France, Italy, and Spain will spur growth in this region. The North American automotive industry is expected to contribute to growth in filter revenue in this region. Also, technological breakthroughs in filtration processes, such as the implementation of nanotechnology, will lead to increased demand. In Central and South America, fluid filter demand is expected to significantly increase through 2028 as several wastewater treatment plants undergo construction due to growing water pollution levels in Brazil, Argentina, and Uruguay among others. The use of filters in Brazilian mining operations to control emissions is also expected to fuel demand in the region.
There are several major filter manufacturers around the world. Many companies are developing sustainable products that offer improved efficiency and value. Some are expanding their production capabilities to meet demand in various markets. Some major companies in this industry include 3M, Airex Filter Corp., Koch Filter, Freudenberg Filtration Technologies SE & Co. KG, Donaldson Co. Inc., Camfil AB, Parker Hannifin Corp., DENSO Corp., Clark Air Systems, and Spectrum Filtration Pvt. Ltd.
Sources: “Filters Market Size, Share & Trends Analysis Report by Product (ICE Filters, Air Filters, Fluid Filters), by Application (Motor Vehicles, Consumer Goods), by Region, and Segment Forecasts, 2021 – 2028,” Grand View Research Report Summary, March 2021 available online here; “Filters Market Size Worth $101.88 Billion By 2028 | CAGR:
4.7%: Grand View Research, Inc.,” CISION PR Newswire, April 5, 2021 available online here. Image source: bb20_pt10, “air-filter-automotive-car-2690190,” Pixabay, August 28, 2017 available online here.
Organic candles made of soy wax and infused with essential oils have become popular in recent years.
Geographic reference: World Year: 2018 and 2025 Market size: $310.7 million and $545.2 million, respectively
Balsam and pine. Gingerbread and peppermint. All scents that conjure in many warm feelings centered around the winter holidays. Whether or not you have live greenery in your home, bake cookies, or fill a candy dish with mints, your home can still be suffused with these aromas by lighting scented candles. Today’s market size shows worldwide scented candle revenues1 for 2018 and projected for 2025. In 2018, scented candles constituted 9% of the overall global candle market.
Candles have been used for thousands of years as both a source of light and in religious observances and celebrations. At this time of year, candles are used to light the menorah to celebrate Hanukkah, the kinara to celebrate Kwanzaa, the Advent wreath in anticipation of Christmas, and the farolitos that mark the homes hosting Las Posadas.
Some early civilizations made wax candles from available plants and insects. In the West, candles originally were made of animal fats. Burning them gave off an unpleasant odor. Scents were added to cover up the pungent smell. Other materials were used to make candles as well, such as spermaceti, beeswax, and paraffin. Beeswax candles emitted a sweet smell but were expensive. Gas and kerosene lamps, then lightbulbs, replaced candles as a way to light homes after dark. As a result, the popularity of candles waned until the mid-1980s when candles became a luxury decor item. Now, candles with colored waxes and decorative holders adorn homes. Scented candles are designed with aromatherapeutic elements to create a relaxing and cozy home environment. Essential oil infused organic candles made of natural ingredients such as beeswax, soy wax, and coconut wax have become more popular in recent years. Scented candles are also popular gifts, especially among millennials. For some, giving scented candles shows “the givers’ wishes for one to always remain enlightened even during the darkest of times.”2
Scented candles come in thousands of varieties, from simple scents such as rose, lavender, and vanilla to more complex blends of scents. Most premium products are comprised of three layers of fragrance, or notes. The top note provides the initial impression. The middle note is the main body of the scent. The base note provides the final impression. For example, Yankee Candle’s Balsam & Cedar has citrus, herbs, and red berries as its top note; pine balsam, cedar, and sandalwood as its middle note; and vanilla, warm amber, and musk as its base note. Together, these provide a woody, forest scent.
Container-based candles garnered 55% of the market in 2018. These candles are convenient for the user. They don’t require a separate holder or stand and the liquid wax remains in the container when the candle is burned. Container-based candles are popular gifts.
In 2018, convenience stores accounted for about 60% of revenues. The large number of convenience stores in India, China, Japan, and Australia are driving sales in this segment. Sales at hypermarkets and supermarkets accounted for a quarter of revenues, with online sales rounding out the rest. Online sales are expected to grow the fastest from 2019 to 2025, at a compound annual growth rate of 9.2%, as more major retailers shore up their online presence. Some of the major online sellers of scented candles include Candle Warehouse, Amazon, Nordic West, Prosperity Candle, and Candles Scandinavia Group AB.
This growth prediction by Grand View Research, however, was made before the COVID-19 pandemic. E-commerce revenues had been growing even before the pandemic, but e-commerce sales overall have spiked in 2020. For the first half of the year, worldwide e-commerce revenues grew 16.5%, with many regions of the world registering higher sales growth. While most of the growth came from essential items such as food and household cleaning supplies, buyers are not limiting themselves to these items. The more people spend time in their homes the more they may want to add comforting elements such as scented candles to their online shopping carts. In the United States, online shopping records were set on Thanksgiving Day, Black Friday, and Cyber Monday, while in-store traffic on Black Friday was down more than 50%. Many people who used to buy holiday gifts, including scented candles, at brick-and-mortar establishments were opting to do all or most of their holiday shopping online this year.
North America claimed 35% of the market in 2018. Before the pandemic, this region was expected to continue to garner a large share of the market through 2025 due to the increasing number of spas, wellness centers, and massage therapy establishments. According to IBISWorld, the number of health and wellness spas in the United States grew from 17,829 in 2012 to 20,067 in 2019. However, the number dropped to 19,733 in 2020. Revenues dropped 7.7% from 2019 to 2020. For those that are still in business, temporary shutdowns and strict health department guidelines due to the COVID-19 pandemic are impacting the number of customers served. It’s likely that these types of businesses have been impacted similarly throughout the region, limiting demand for scented candles in this sector. The Asia-Pacific region is expected to experience the highest growth through 2025 as the popularity of gifting scented candles grows in countries such as China, India, Japan, Thailand, Australia, and New Zealand. Several major global manufacturers of scented candles include Newell Brands,3 KORONA Candles Sp. z o.o., Gala-Kerzen GmbH, The Very Good Candle Co., Goose Creek Candle, The Copenhagen Candle Company Ltd., Broken Top Candle Co., Bridgewater Candle Co., and Kringle Candle Co.
1 At hypermarkets, supermarkets, convenience stores, and online. 2 “Scented Candles Market Size, Share & Trends Analysis Report by Product (Container Based, Pillars), by Distribution Channel (Hypermarket & Supermarket, Convenience Stores), by Region, and Segment Forecasts, 2019 – 2025,” Grand View Research Report Summary, January 2020 available online here. 3 Brands include Chesapeake Bay Candle, WoodWick, and Yankee Candle.
Sources: “Scented Candles Market Size, Share & Trends Analysis Report by Product (Container Based, Pillars), by Distribution Channel (Hypermarket & Supermarket, Convenience Stores), by Region, and Segment Forecasts, 2019 – 2025,” Grand View Research Report Summary, January 2020 available online here; “Scented Candles Market Size to Reach $545.2 Million by 2025 | CAGR: 8.4%: Grand View Research, Inc.,” CISION PR Newswire, January 28, 2020 available online here; “History,” National Candle Association available online here; “8 Farolito Photos to Brighten the Holiday,” The Santa Fe Travel Insider, December 8, 2015 available online here; “A Short History of Scented Candles,” Ashleigh & Burwood, March 18, 2019 available online here; “Candle Market Size, Share & Trends Analysis Report by Product (Votive, Container, Pillars, Tapers), by Wax Type (Paraffin, Soy Wax, Beeswax, Palm Wax), by Distribution Channel, and Segment Forecasts, 2019 – 2025,” Grand View Research Report Summary, July 2019 available online here; “How COVID-19 Has Transformed Consumer Spending Habits,” J.P. Morgan available online here; Alexandra Samet, “Ecommerce Sales Will Decelerate This Year Globally — But Certain National Markets May See Success,” Business Insider, July 22, 2020 available online here; Melissa Repko and Lauren Thomas, “Online Sales Reach $10.8 Billion on Cyber Monday, the Biggest U.S. E-Commerce Day Ever, Adobe Says,” CNBC, December 1, 2020 available online here; “Health & Wellness Spas in the US – Number of Businesses 2005-2026,” IBISWorld, June 30, 2020 available online here; “Health & Wellness Spas in the US – Market Size 2005-2026,” IBISWorld, June 30, 2020 available online here; Lauren Thomas, “Black Friday Shopping in Stores Craters 52% During Pandemic as E-commerce Sales Surge,” CNBC, November 28, 2020 available online here. Image source: Untitled photo by Hanna Balan on Unsplash, April 22, 2020 available online here. Use of image does not constitute endorsement.
Laundry detergent. Enzymes in laundry detergent allow clothes to be washed in cold water.
Geographic reference: World Year: 2019 and 2027 Market size: $9.9 billion and $17.2 billion, respectively Sources: “Enzymes Market Size, Share & Trends Analysis Report by Application (Industrial Enzymes, Specialty Enzymes), by Product (Carbohydrase, Proteases, Lipases), by Source, by Region, and Segment Forecasts, 2020 – 2027,” Grand View Research Report Summary, March 2020 available online here; “Enzymes Market Size Worth $17.2 Billion by 2027 | CAGR 7.1%: Grand View Research, Inc.,” CISION PR Newswire, March 16, 2020 available online here; Sindhu Raveendran, et. al., “Applications of Microbial Enzymes in Food Industry,” Food Technology & Biotechnology, March 2018 available online at the U.S. National Library of Medicine, National Institutes of Health here; JanMaarten van Dijl and Michael Hecker, “Bacillus Subtilis: From Soil Bacterium to Super-secreting Cell Factory,” Microbial Cell Factories, January 14, 2013 available online here; “A Global Fermentation Approach,” Leaf by Lesaffre available online here; “Specialty Enzymes Market Worth $6.6 Billion by 2025,” MarketsandMarkets Press Release, April 20, 2020 available online here. Image source: habelfrank, “washing-powder-detergent-1500058,” PIxabay, July 7, 2016 available online here.
Enzymes are proteins that act as catalysts. Enzymes in the body run cellular processes and convert food to energy and to building blocks for proteins, lipids, nucleic acids, and some carbohydrates. Industrial enzymes such as proteases, amylases, lipases, and others are used in various applications: in the food and beverage industry, in detergents, animal feed, biofuels, textiles, pulp and paper, nutraceuticals, personal care products and cosmetics, wastewater treatment, and medications. In 2018, 60% of industrial enzymes on the market were proteases. In Europe, 900 tons of protease enzymes are used for detergents alone every year.
Today’s market size shows the global enzyme revenues for 2019 and projected for 2027. Microorganism-based enzymes comprised the vast majority of the industrial enzyme market in 2019, about 85%, followed by animal-based and plant-based enzymes. Microorganisms are preferred as a source due to their more predictable and controllable enzyme content. This type of enzyme can also be produced in a cost-effective manner with less space and time necessary than animal-based or plant-based enzymes.
There are three types of microorganism-based enzymes: bacterial, fungal, and yeast. Bacterial enzymes are mostly sourced from Bacillus. They’re used in food and detergent and in pharmaceutical applications to diagnose diseases, promote wound healing, and kill disease-causing microorganisms. Fungal enzymes are used in the preparation and production of soy sauce, beer, baked goods, processed fruits, and dairy products. Yeast is used in beer, baked goods, and industrial ethanol production.
Increased investment in biotechnology research for the development of specialty enzymes for medicinal and diagnostic purposes is one of the main factors driving product demand globally. Increasing demand from the food and beverage, biofuel, animal feed, and home cleaning sectors along with the growing consumption of functional foods will contribute to the growth in the market through 2027.
By region, growing biofuel production in North America and Europe, as well as increasing meat production in Europe and the Russian Federation, are expected to contribute to growth in these regions. Enzymes are used extensively in meat processing to improve the tenderness of the meat. Europe was third behind China and North America in meat production in 2018. The top three companies in this industry—Novozymes, DuPont Danisco, and DSM— claimed more than 75% of the market in 2019.1 Other major companies in this industry include BASF SE, Associated British Foods PLC, Chr. Hansen Holding A/S, and
Advanced Enzyme Technologies.
1 Source: Grand View Research. The press release from CISION PR Newswire mentioning the same Grand View Research report states that the top 3 companies are Novozymes, DuPont Danisco, and BASF SE.
With the popularity of tablets and smartphones, one would think that old-fashioned pen and paper would fall out of favor. But worldwide sales of pens and other writing instruments is expected to increase, from $16.2 billion in 2014 to $20.2 billion in 2019 according to the report Global Writing and Marking Instrument Market 2015-2019 by Technavio. Increased population and literacy levels are fueling demand in Asia, Latin America, and the Middle East. In the United States and Europe, luxury pens are in demand as gift items and as fashion accessories. Some brands of luxury pens include Cross, Krone, Parker, Think, and Waterman.
Today’s market size presents the total retail sales of one segment of this market: fountain pens. Global sales of fountain pens increased 2.1% from 2015 to 2016.
Geographic reference: World Year: 2016 Market size: $1 billion Sources: Thomas, June, “How Nakaya Pens Anticipated The Writing-Tool Renaissance,” Bloomberg Businessweek, August 30, 2017 available online here; Yerak, Becky, “How The Pen Industry Hangs On In A Digital World,” Chicago Tribune, January 29, 2016 available online here. Original source:Euromonitor International Image source: Jackmac34, “Pen-fountain-pen-ink-gold-writing-631321,” Pixabay, February 11, 2015 available online here.
Amazon Echo and Google Home are two versions of wireless speakers that do more than play music. They are also voice-activated personal assistants. Some of their capabilities include adjusting a smart thermostat, turning lights on or off, arranging a ride through Uber, and delivering the news, sports, and weather. As prices have come down for these devices, in some cases retailing for less than $50, popularity has risen.
Today’s market size is the value of the market for voice-activated wireless speakers/personal assistants in 2015 and the projected value of the market in 2020 according to Gartner. The value of the market is expected to increase more than 5-fold in this 5-year period.
Geographic reference: World Year: 2015 and projection for 2020 Market size: $360 million and a projected $2.1 billion respectively Source: Ed Baig, “Google Home Plays Catch-Up to Echo, with Promise,” USA Today for the Lansing State Journal, November 6, 2016, page 6B Original source: Gartner.
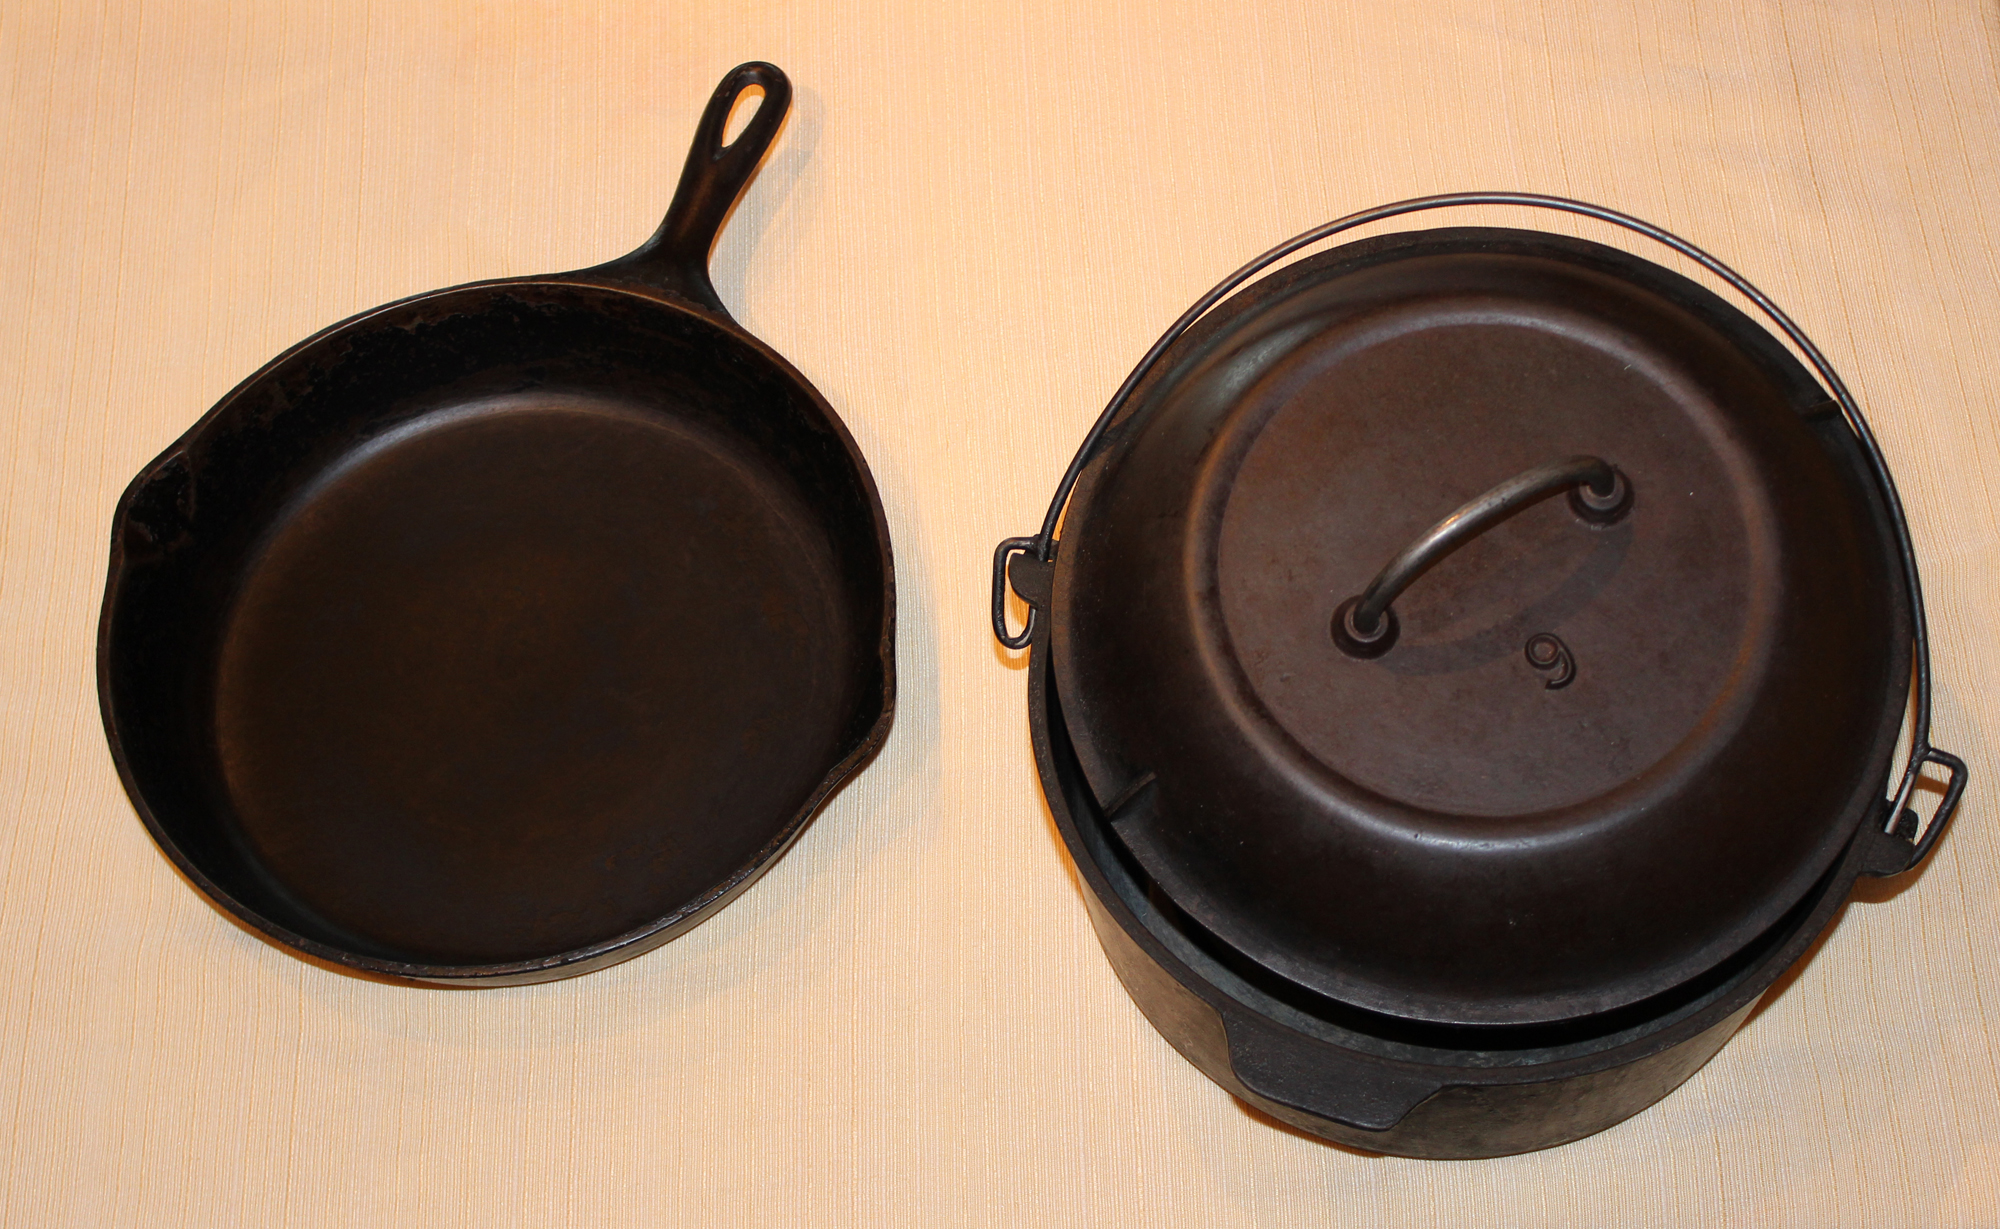
In the past 10 years, sales of cast iron cookware has gone from 4 percent to 10 percent of the entire cookware market. Lodge Manufacturing, founded in 1896 in the United States, and Le Creuset, founded in 1925 in France are two of the oldest manufacturers of cast iron cookware. Data show industry sales of cast iron cookware in 2011.
Geographic reference: United States Year: 2011 Market size: $114 million Source: Josh Ozersky, “A Pan for All Seasons,” Time, March 26, 2012, available online here. Posted on May 14, 2013
Products purchased to help organize the garage constitute the fastest growing segment of the home storage and organization market. In recent years, the garage has become more than just a place to park cars. Only 35% of garages made to fit at least two cars have room for more than one. While many homeowners use their garage for storage, there’s a growing segment of the population that use their garage as an extension of their home — installing granite floors, wide-screen televisions, and state of the art sound systems.
Data show the projected size of the garage storage and organization market in the United States in 2015. That year, the total home storage and organization market is expected to reach $9 billion, which means that the garage segment will represent nearly a fifth of the total market. Managing all of our stuff has become a real job and for some, a business.
Geographic reference: United States Year: 2015 Market size: $2 billion Source: Jayne O’Donnell, “Garages Can Be a Man – Or Woman – Cave,” Detroit Free Press, April 21, 2013, available online here. Original source: Freedonia Group Posted on April 25, 2013
Many people who own tablet computers, laptops, and e-readers own wireless routers. Wireless routers allow them to connect to the Internet through these devices from anywhere in their homes. Data show sales of home wireless routers in 2005 and 2011.
Geographic reference: United States Year: 2005 and 2011 Market Size: $700 million and $1.3 billion respectively Source: Tamara Chuang, “When the Home’s Most Important Internet Device Fails,” The Street, September 17, 2012, available online here. Original Source: Dell’Oro Group Posted on September 26, 2012
Sodium sulfate is an inorganic chemical that looks like a white powder. Its chemical symbol is NA2 SO4. Sodium sulfate is used in the production of many products. Soaps and detergents account for the largest single share (35%) of its consumption. Other end uses of sodium sulfate include glass manufacturing which accounts for 18% of consumption, the paper and pulp industry uses 15%, and textile production accounts for 4% of consumption in the United States. The remaining 28% of consumption is divided among many smaller consuming end users.
The market size presented below is the estimated total value of all natural and synthetic sodium sulfate sold in 2010.
Geographic reference: United States Year: 2010 Market size: $42 Million Source: “Sodium Sulfate Statistics Information,” part of an annual series titled Mineral Commodities Summaries, published by the U.S. Geographical Survey and available online here. Original source: U.S. Department of the Interior, USGS
Housewares is a category of products covering a large range of different sorts of items. Here is a list: floor care products; metal cookware; kitchen tools & gadgets; plastic storage; air treatment products; blenders & food processors; cutlery; metal bakeware, and toasters. Today’s market size is an estimate of the total retail sales value of all items in this category during 2010. It shows a 2% increase over retail sales in 2009.
Geographic reference: United States Year: 2010 Market size: $52.2 billion Source: “It’s Alive! Home Furnishings Sales—Put on Life Support Last Year—Show Signs of Life,” HFN Home Furnishings News, February 2011, page 16. Original source: McFadden Communications Group LLC
This market size, presented for 2007 and 2010, clearly shows the impact that the recession which began in December of 2007 has had on the worldwide sale of household appliances. The market sizes listed here include retail sales of refrigerators, other than compact refrigerators; freezers; dishwashers; ovens; ranges; range hoods; cooktops; washers and dryers.
Geographic reference: World Year: 2007 and 2010 Market size: $14.2 and $13.1 billion respectively Source: Hagerty, James R. and Sven Grundberg, “Whirlpool and Electrolux Post Weak Results, Face Price Pressures,” The Wall Street Journal, February 3, 2011, page B6. Original source: NPD Group
The number of working smoke detectors in residential housing units in the United States is listed below. This figure translates into a single smoke detector in 87% of all residential housing units in the country, which is an encouraging number. However, a more promising figure would be well over 100% since that would mean that many homes made use of more than a single smoke detector, as is recommended by the U.S. Fire Administration, part of the Federal Emergency Management Agency, on its website here.
Geographic reference: United States Year: 2009 Market size: 116,141,000 detectors Source: “Housing Units—Characteristics by Tenure and Region: 2009,” Statistical Abstract of the United States: 2011, Table 983, U.S. Census Bureau, page 616. Original source: U.S. Department of Commerce, Bureau of the Census.
This market, as defined by the source, can be broken down into the following four categories: outdoor furniture (with 57% of the market), grills (20%), accessories (19%) and patio heating products (4%). The market is forecast by the source to reach $7.2 billion in 2013.
Geographic reference: United States Year: 2008 Market size: $6.12 billion Source:Outdoor Furniture and Grills, December 2009 Original source: Freedonia Group


 With the popularity of tablets and smartphones, one would think that old-fashioned pen and paper would fall out of favor. But worldwide sales of pens and other writing instruments is expected to increase, from $16.2 billion in 2014 to $20.2 billion in 2019 according to the report