Polyaryletherketone

Plastic polymer granules

Polyaryletherketone, or PAEK, is a group of thermoplastics that is strong, flexible, and durable. These thermoplastics are resistant to corrosion and do not break down when sterilized. They can be machined and are versatile for many applications in the oil and gas, electrical and electronics, aerospace, automotive and medical industries. Seals, valves, and bearings for oil drilling; surgical implants; chemical pumps; and automotive gears are some of the applications for various forms of PAEK.

Three types of PAEK thermoplastics are polyetheretherketone (PEEK), polyetherketone (PEK), and polyetherketoneketone (PEKK). PEEK thermoplastics are used as a replacement for metal in high temperature and high wear applications. Depending on the use, glass or carbon fillers are added to PEEK to increase its strength and thermal stability. Unfilled PEEK has low smoke and toxic gas emissions when burned. As a result, it’s often used in airplane interiors. PEEK is also used to manufacture items such as bearings, piston parts, and electrical cable insulation. Increasingly, it’s being used for spinal fusion devices and reinforcing rods.

PEK thermoplastics are used for components that need to retain their strength when exposed to high temperatures over long periods. Gears, shafts, bushes, bearings, and miniature rotational precision parts in the aerospace and automotive industries are some of the end uses for PEK.

PEKK, like PEEK, lends itself to uses in 3D printing applications. However, PEKK has 80% more compression strength than PEEK and is naturally antibacterial. Because of its antibacterial properties, its osteoconductivity properties allowing for bone growth and its radiolucent properties compatible with MRI machines, this material is used in patient-specific 3D-printed implants. Oxford Performance Materials, Inc. received U.S. Food and Drug Administration approval for its PEKK cranial and fascial implants in 2013 and 2014, respectively. In 2019, this company obtained a license to sell its PEKK implants in various countries throughout Asia. PEKK, like other PAEK thermoplastics, is used in end-market industrial components also.

Today’s market size shows the expected total global revenue for PAEK thermoplastics in 2019 and 2024. In 2018, PEEK had the highest market share. Demand for PEEK is expected to increase during this time due to increased demand from the oil and gas, electrical and electronics and medical industries. Worldwide, the APAC region is projected to have the highest market share, 41%, followed by North America (30%), and Europe (10%). Some leading providers of PAEK products include Victrex PLC, Solvay, Evonik Industries AG, Arkema SA, Celanese Corporation, Gharda Chemicals Ltd., and Panjin Zhongrun High-Performance Polymers Co. Ltd.

Geographic reference: World
Year: 2019 and 2024
Market size: $851 million and $1.15 billion, respectively
Sources: “The PAEK Market Size is Expected to Grow from USD 851 Million in 2019 to USD 1,149 Million by 2024, at a CAGR of 6.2%,” Olean Times Herald, October 23, 2019 available online here; “PAEK Market by Type (PEK, PEEK, PEKK), Fillers (Glass Filled, Carbon Filled, Unfilled), Application (Oil & Gas, Electricals & Electronics, Automotive, Medical, Aerospace), Region (APAC, Europe, North America, South America, MEA) – Global Forecast to 2024,” Marketresearch.com Report Description, October 2019 available online here; “Polyaryletherketone,” Wikipedia, November 25, 2017 available online here; Andy Pye, “Operating at PAEK Performance: An Overview of Polyaryletherketones,” Prospector, February 10, 2017 available online here; “PEEK (Polyetheretherketone),” Performance Plastics available online here; “PEEK vs. PEK vs. PTFE,” Greene Tweed available online here; Marco, “All You Need to Know About PEKK,” 3devo, June 28, 2017 available online here; Daphne Allen, “3D Printer of PEKK Implants Expanding in Asia,” MD+DI, July 20, 2018 available online here.
Image source: feiern1, “plastic-polymer-granules-1061731,” Pixabay, November 25, 2015 available online here. Picture is of plastic polymer granules, not PAEK thermoplastic granules.

Hardware Stores

Today’s market size is the value of sales made through hardware stores in the United States in 2011. Sales were down slightly from 2008 (0.06%) but higher than sales in 2009 and 2010. Hardware stores as measured here do not include large building supply stores such as Home Depot or Lowes. For those familiar with the industrial coding system [North American Industrial Classification System – NAICS] used by the U.S. Census Bureau, as well as the corresponding data gathering agencies in Canada and Mexico, this industry is number 44413.

Geographic reference: United States
Year: 2011
Market size: $20.13 billion
Source: “Annual Revision of Monthly Retail and Food Services: Sales and Inventories—January 1992 through March 2012,” Monthly & Annual Retail Trade, available online here.
Original source: U.S. Department of Commerce, Bureau of the Census
Posted on January 31, 2013

Data Loss

That sinking feeling… we have all probably been there, face to face with a computer we count on that has begun to act up. The loss of data resulting from computer hardware failure, software corruption or even human error, is painful and costly. Measuring the loss is a difficult task but one that was undertaken by Dr. David M. Smith and reported on in the article from which we source today’s market size post. A full citation is below.

Specifically, the market size presented here is the estimated annual loss to businesses in the United States due to data losses on PCs and laptops. It dates back to 2003 but it provides us with a scope for the problem and a scope that we know has only grown. For further details, check the source article which defines things clearly.

Geographic reference: United States
Year: 2003
Market size: $18.2 billion
Source: David M. Smith, “The Cost of Lost Data,” Graziadio Business Review, 2003, available online here.
Original source: Graziadio School of Business and Management, Pepperdine University
Posted on December 1, 2011

Compact Discs

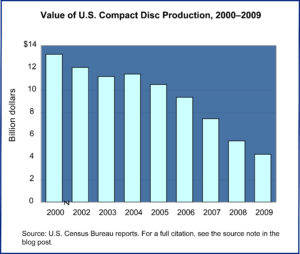
US Production of CDsCompact discs, or CDs, appeared on the recording media scene and rapidly became the standard, demand for them growing in leaps and bounds. But their position as market leader was a passing thing. As digital recording media they are still used but in ever smaller numbers, as the graphic shows. Part of the decline in production is the result of production going overseas. But a shift in how we record and store digital information is the primary cause for the decline of CDs.

Today’s market size is the value of U.S. manufacturer shipments of CDs in 2009. These values refer to blank CDs, to the storage media and not products later sold and distributed on that compact disc media.

Geographic reference: United States
Year: 2009
Market size: $4.27 billion
Source: “Table 1139. Recording Media—Manufacturers Shipments and Value: 2000 to 2009,” Statistical Abstract of the United States: 2011, January 20, 2011, page 716, available online here.
Original source: U.S. Census Bureau

Hardware Merchant Wholesalers

Wholesalers of hardware in the United States have seen tough times in the last decade which is somewhat surprising given the robust nature of the construction business during the period in question, 1997 to 2007. In fact, on the retail side of the business, hardware stores and home improvement centers saw growth over this period. It is worth noting that this industry saw some growth between 2002 and 2007, during the height of the housing boom. We provide market size data on this industry for all three census years to show this down up cycle. Despite the increase in sales from 2002 to 2007, they did not reach back to the 1997 level. If we look at inflation adjusted dollar sales, this industry’s sales in 2007 were 21% lower than in 1997.

Those involved with the wholesaling of hardware—defined for this market by the Census Bureau as “establishments primarily engaged in the merchant wholesale distribution of hardware, knives, or handtools,” [NAICS 42-3710]— may be suffering from the rise of the big box retailer who in many cases deals directly with the manufacturer to obtain merchandise. But, we will leave a closer look at retailers until next week.

Geographic reference: United States
Year: 1997, 2002 and 2007
Market size: Number of Establishments: 9,473; 6,841 and 6,921 respectively.
Market size: Sales: $44.06; $32.83 and $43.90 billion respectively.
Market size: Employment: 110,963; 81,734 and 88,859 respectively.
Source: “Sector 42: EC0742I2: Wholesale Trade: Industry Series: Preliminary Comparative Statistics for the United States (2002 NAICS Basis): 2007 and 2002,” 2007 Economic Census, available online here. The data from 1997 are from the 1997 Economic Census, after conversion of the data to a NAICS 2002 basis.
Original source: U.S. Department of Commerce, Bureau of the Census.