Orange Juice

Faced with a greater variety of beverage choices, including exotic juices and energy drinks, and higher prices for orange juice due to the spread of citrus greening disease, consumers are increasingly choosing those alternatives over the breakfast staple, orange juice. Total U.S. retail unit sales in the 2012-2013 season reached its lowest level since the 1998-1999 season.

Data show the total U.S. retail sales of orange juice by volume in the 2012-2013 season.

Geographic reference: United States
Year: 2012-2013
Market size: 563.2 million gallons
Source: Alexandra Wexler, “The Slow Death of a Former Breakfast Table Star,” The Wall Street Journal, October 14, 2013, available online here.
Original source: Nielsen
Posted on October 29, 2013

Organic and Natural Juices

Just as more and more people are choosing to buy organic produce, so too are they looking for similar choices in the juice aisle of the supermarket or health food store. Data show organic and natural juice revenue for 2012, a 13% increase over 2011.

Geographic reference: United States
Year: 2012
Market size: $2.4 billion
Source: Clare O’Connor, “Hain Celestial is Juiced,” Forbes, August 12, 2013, pages 40-42.
Original source: Nutrition Business Journal
Posted on August 21, 2013

Organic Products

Currently there are more than 17,000 certified organic businesses in the United States. In 2011, sales of organic foods made up more than 4% of all food and beverage sales. In 2012, sales of organic products grew 10%. Growth in this industry is expected to continue due to increasing consumer demand.

Today’s market size is the dollar amount of organic product sales in United States in 2012.

Geographic reference: United States
Year: 2012
Market size: $35 billion
Source: Mary Clare Jalonick, “Demand Aids Organic Industry’s Sway,” Lansing State Journal, May 19, 2013, page 6A.
Posted on May 22, 2013

Açaí Berries and Superfoods

The açaí berry is native to the Amazon rainforest and in particular to Brazil. It is a berry that has high quantities of phytochemicals, plant compounds that are believed to protect us from a variety of ills, from heart disease to cancer. Through heavy marketing of the berry as a sort of miracle cure, a market for this fruit was created and grew rapidly, reaching a high in 2009.

The açaí berry is what is often called a superfood, a category of foods that are nutrient dense, thus rich in vitamins, minerals and other nutrients while having few calories. So-called superfoods that are new to the U.S. market appear to follow a somewhat predictable cycle. They become the hyped new health food. Demand for them rises sharply and they ride this tide. Then they begin a decline as their high prices are balanced against the consumer’s experience with them and the promise of a new, heavily marketed superfood. Worth noting is the fact that blueberries are very nearly as rich in polyphenols as are açaí berries yet they are priced at a fraction of the price of açaí berries.

Today’s market size is an estimate of the total value of açaí-laced products sold in the United States in 2012.

Geographic reference: United States
Year: 2012
Market size: $200 million
Source: Tom Philpott, “Farm to Fable,” Mother Jones, May/June 2013, page 68
Posted on April 23, 2013

Craft Beers

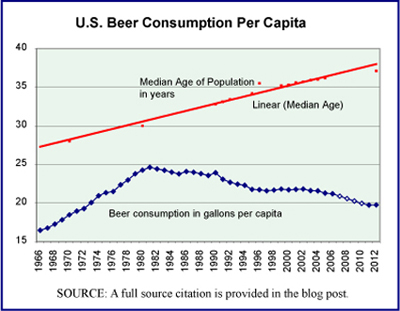
Beer consumption and median age of population

While the overall U.S. consumption of beer, measured in terms of per capita consumption, has been declining steadily since the 1980s, as can be seen in the graphic, the craft beer market has been doing quite well. Craft beers are those made by brewers whose annual production is less than 6 million barrels, who use traditional methods of brewing and are independently owned. The number of craft brewers in the United States has risen from 1,753 in 2010 to 2,403 in 2012 and craft brewers in 2012 accounted for 6.5% of the overall beer market by volume and 10.2% by value of sales.

The graph presents per capita beer consumption in the Untied States from 1966 through 2012 with a red line showing the median age of the U.S. population.

Today’s market size is based on sales of craft beer in the United States in 2012, by volume and value. In volume terms, the craft beer market grew by 15% between 2011 and 2012 and by value, it grew by 17%.

Geographic reference: United States
Year: 2012
Market size: 13.24 million barrels (410.44 million gallons) valued at $10.2 billion.
Source: “Craft Brewing Facts,” Brewers Association, March 18, 2013, available online here. The graphic comes from Patricia J. Bungert and Arsen J. Darnay, editors, Encyclopedia of Products & Industries — Manufacturing, Figure 19, page 96, Gale Cengage Learning, 2008, updated here with data cited above from the Brewers Association’s website.
Original source: Brewers Association and U.S. Census Bureau
Posted on April 10, 2013

Champagne

By definition, champagne is a product of France. In order to be called champagne, a sparkling wine must be made with grapes from the Champagne region of France and must meet an additional set of requirements imposed by the Comité Interprofessionel du Vin de Champagne (CIVIC). The United Kingdom is the largest importer of champagne, followed by the United States and then Germany. U.S. imports of champagne started off the first decade of the new century averaging 18 million bottles annually, it peaked at 23.2 million bottles in 2006 and fell thereafter for three consecutive years. In 2010, champagne imports to the United States saw a small increase from prior year imports.

Today’s market size is the estimated total number of bottles of champagne exported by France in 2011.

Geographic reference: Worldwide
Year: 2011
Market size: 335 million bottles
Source: Tiffany Hsu, “Champagne Sales Surged in 2011, Booze Headed for 2012 Boost,” January 1, 2012, Los Angeles Times, available online here.
Original source: Comité Interprofessionel du Vin de Champagne and the Champagne Bureau
Posted on December 27, 2012

Cranberries

Today we look at cranberries, one of the ingredients of a traditional Thanksgiving Day meal in the United States. The market we present here is the size, measured in barrels, of U.S. cranberry production annually over four decades.

We hope that as the Thanksgiving Holiday weekend proceeds in the United States, that all of our visitors have many reasons to give thanks this year.

Geographic reference: United States
Year: 1980, 1990, 2000, 2010
Market size: 2.70, 3.44, 5.84, and 6.81 million barrels respectively
Source: “Cranberries—2012 Cranberry Production Down Slightly,” August 14, 2012, and earlier reports on cranberry production, all produced and made available by the U.S. Department of Agriculture’s National Agricultural Statistics Services. The Annual reports on cranberry production are listed on the USDA’s website here.
Original source: U.S. Department of Agriculture
Posted on November 21, 2012

Functional Foods Market

At the most elemental level, we eat to supply our bodies with the nutrients necessary to maintain life. So by definition, food has a rather important function. However, the term functional food refers to processed foods and drinks that are marketed as having “health-promoting or wellness-maintaining properties”. The labels on such foods often include messages such as heart healthy, helps reduce cholesterol, clinically shown to improve kids attentiveness, helps support your immune system or your digestive system or your nervous system, etc.

Geographic reference: United States
Year: 2009
Market size: $37.3 billion
Source: Singer, Natasha, “Food With Benefits, or So They Say,” The New York Times, May 15, 2011, page B1, available online here.
Original source: Nutritional Business Journal

Coffee

Today’s market size offers a measure of the world’s coffee production. The U.S. Department of Agriculture tracks many, many agricultural products, geographically, by output, by shipment and even by consumption. Another example of how the Federal government’s data collection agencies provide us with an extremely valuable service.

Happy tax day!

Geographic reference: World
Year: 2000-2001 and 2010-2011
Market size: 117,521 and 139,084 thousand 60-kilogram bags respectively
Source: “Table 01 – Coffee World Production, Supply and Distribution,” Coffee: World
Markets and Trade,
December 2010, page 4, available online here.
Original source: U.S. Department of Agriculture, Foreign Agricultural Service

Honey

The U.S. Department of Agriculture’s National Agricultural Statistics Service (NASS) produces annual reports on individual commodities. One of the commodities they track is honey. The market sizes presented today are various years worth of honey production in the United States by producers that have at least 5 colonies of bees.

Geographic reference: United States
Year: 1990, 1993, 2003 and 2009, 2010
Market size: 196, 230, 181, 146 and 176 million pounds respectively
Source: “Honey,” February 2011, February 27, 2004, February 18, 1994, and Feburary 13, 1991. These annual reports are available online here.
Original source: U.S. Department of Agriculture, NASS

Pollinators

An often heard or read phrase related to agricultural production goes as follows: You can thank pollinators for one out of three bites of food you eat. Of course, that assumes you have a nutritionally balanced diet. But the point is clear. One-third of crops used to produce food for human consumption come from plants that depend on pollination to reproduce. In the United States it is estimated that the value annually of crops that are pollinated by insects is $40 billion and this figure does not include the value of non-food crops that also depend upon pollinators, like cotton, for example. The market size figure presented below is an estimated value to the world every year of pollination done by insects and animals.

For anyone not familiar with pollination, it is the process by which pollen is moved from one place on a flowering plant to another. Pollen grains contain the male contribution to the fertilization process and are moved through pollination to the female parts of the plant so that offspring may be produced. Without pollination, a flowering plant will not bear fruit or seeds. Insects and some animals serve as transporters in this process, as does the wind for some plants.

Geographic reference: World
Year: 2010
Market size: $200 billion
Source: “Gold Dusters,” National Geographic, March 2011, page 121.
Original source: United Nations, Food & Agriculture Organization (FAO). Another source of interesting information about pollination and crops is available here from the National Biological Information Infrastructure, a program administered by the U.S. Geological Survey.

Coffee in Puerto Rico

Puerto Rico is experiencing a decline in its coffee production. Over the period from 2002 to 2009 the island saw a decline of more than half in the number of farms growing coffee beans, from 9,000 in 2002 to 4,000 on 2009. According to the source article, the reasons for this decline are varied and include flooding from recent tropical storms as well as difficulty finding enough workers to pick the coffee beans at harvest time. Despite high unemployment rates an estimated $25 million worth of coffee was left unpicked in the 2009-2010 season, according to the Puerto Rico Coffee Buyers & Growers Association.

Geographic reference: Puerto Rico
Year: 2006 and 2010
Market size: 178,000 pounds and 80,000 pounds respectively. The harvest in 2010 had an estimated value of $23 million.
Source: “Sharp Drop in Coffee Production on Puerto Rico Worries Growers,” The Avis, February 19, 2011, St. Croix, Virgin Islands.
Original source: Puerto Rico Coffee Buyers & Growers Association.

Champagne Consumption

Not surprisingly, the nation with the largest consumption of champagne is the nation in which champagne is made, namely, France. The French consume approximately 177.6 million bottles of champagne each year. In terms of per capita consumption, two of France’s territories actually out consume the French population. Guadeloupe has an annual per capita consumption of champagne that is the highest in the world at 3.74 bottles per person. Next is Martinique with a per capita consumption of 3.3 bottles per person and France comes in third with per capita consumption of just under 3 bottles per person (2.93 bottles).

For a list of the countries with the highest champagne consumption, look at the table to which we provide a link in the source note below. Column 3 shows the number of bottles sold annually by country, in millions, and column 7 shows the per capita, bottle consumption figure per country.

Happy New Year!

Geographic reference: World
Year: 2009 (based on publication date)
Market size: 300.62 million bottles annually
Source: de Nederlandse Champagne Pagina’s, a website presenting interesting statisitcs about the champagne business worldwide, available online here.

Tea Sales

While coffee is still the hot drink of choice for most Americans, sales of tea have been growing for more than a decade now. Tea sales rose 32% between 2005 and 2009 according to market researcher Packaged Foods.

Geographic reference: United States
Year: 2009
Market size: $8.5 billion of which 67.1% was sold at retail.
Source: Melissa Domsic, “E. Lansing Teahouse Brings Wanderers Home,” The Towne Courier, December 5, 2010, pages 14-15
Original source: Specialty Coffee Retailer

Global Market for Premium Chocolate

In terms of market share, Europe accounts for just over half of the world premium chocolate market. In terms of per capita consumption of all chocolate, by country, the leaders are: Switzerland with 22.4 pounds, Austria with 20.13 pounds and Ireland with 19.47 pounds. The United States comes in 8th on the list with an average of 11.7 pounds counsumed annually by each American. Please note, however, that these per capita consumption rates are for all chocolate not just premium chocolate. The market size presented below is the size of the premium chocolate market.

Geographic reference: World
Year: 2007
Market size: $6.9 billion
Source: “AROQ’s Global Market Review Series,” November 2008, page 3
Original source: just-food

Premium Chocolate Market

Europeans eat a lot of chocolate. In fact, the three nations with the highest per capita consumption of chocolate in the world are in Europe: Switzerland, Austria and Ireland. Premium chocolates represent about 12% of the overall chocolate market in Europe.

Geographic reference: Europe
Year: 2007
Market size: $3.8 billion
Source: “AROQ’s Global Market Review Series,” November 2008, page 3
Original source: just-food

Functional Foods

The term “functional foods” was first introduced in Japan in the 1980s and refers to processed foods that contain, by design, ingredients that aid specific bodily functions in addition to being nutritious. Some might simply call these processed foods “enriched foods.”

Geographic reference: World
Year: 2008
Market size: $85 billion
Source: AROQ’s Global Market Review Series, October 2009
Original source: just-food

Vending Machine Market

Vending machines in manufacturing facilities represent 33.5% of all vending machines in place. Office buildings account for 22.5% of vending machine locations while schools and colleges account for 11.5%. The remaining vending machines are in locations as diverse as shopping malls, hotels, airports, gas stations, hospitals and other service outlets and public institutions.

Geographic reference: United States
Year: 2007 and 2008
Market size: $23.2 billion and $22.8 billion respectively
Source: Automatic Merchandiser, August 2009, page 28

Artificial Sweeteners

Leading artificial sweeteners include Splenda (sucralose), Equal (aspartame, also sold as NutraSweet), and Sweet’N Low (saccharin).

Geographic reference: United States
Year: 2008 and 2013
Market size: $1.1 billion and 1.3 billion respectively
Source: “Alternative Sweeteners,” May 2009 available online here.
Original source: Freedonia Group

Size of the Market for Soy-Based Chemicals

Soy-based chemicals are used in the following industries: biodiesel (61%), foods and beverages (16%), plastics (10%) and all others (13%). The success of the soy chemicals industry is dependent on the continued penetration of biodiesel, as well as the adoption of alternatives to traditional, petrochemical-based materials in the manufacture of industrial products. Methyl soyate is by far the most established soy chemical due to its current dominance of the biodiesel market, although it will begin to face competition from other raw materials. Methyl soyate is also finding greater use as a solvent in a variety of markets, including cleaning products as well as paints and coatings. Other soy oil derivatives, such as polyols, will benefit from corporate initiatives to use more renewable feedstocks, as well as from consumer demands for “greener” products, particularly in the plastics (e.g., foam products) and paint and coatings markets.

Geographic reference: United States
Year: 2008
Market size: $1.9 billion
Source: Soy Chemicals, September 2009 available online here.
Original source: Freedonia Group