Ready-to-Eat Popcorn

ready-to-eat popcorn
National Popcorn Day is January 19th.
Geographic reference: World
Year: 2018 and 2026
Market size: $2.53 billion and $6.22 billion, respectively.

“Have you ever pondered the miracle of popcorn? It starts out as a tiny, little, compact kernel with magic trapped inside that when agitated, bursts to create something marvelously desirable. It’s sort of like those tiny, little thoughts trapped inside an author’s head that―in an excited explosion of words―suddenly become a captivating fairy tale!”
Richelle E. Goodrich

Whether it’s buttered and salted, caramel-coated, or tossed with spicy buffalo sauce seasoning, popcorn is a favorite snack among those who are looking to indulge their cravings as well as those looking for better-for-you, healthier snack options. While certain coatings may negate some of its healthful benefits, popcorn contains concentrated sources of fiber, polyphenolic compounds, vitamin B complex, antioxidants, and assorted proteins. Air-popped popcorn has 31 calories per cup; oil-popped 55. Today’s market size shows the global revenues for ready-to-eat popcorn in 2018 and projected for 2026.

Many scholars agree that popcorn originated in the Americas. The oldest ears of popcorn ever found were discovered in a bat cave in west-central New Mexico in 1948. They are estimated to be 5,600 years old. Early North American explorers noticed Native Americans not only eating popcorn but also using it in necklaces and headdresses. European settlers ate popcorn as a breakfast food with milk or cream. During the Great Depression, popcorn became popular as a low-cost snack and with most of the supply of sugar used for the war effort, popcorn became an alternative to sugary snacks during World War II. 

Popcorn comes in two shapes: snowflake (or butterfly) and mushroom. The snowflake variety is larger and is the type sold in movie theaters, ballparks, and other entertainment venues. The snowflake variety is also the type people buy to pop at home. The mushroom variety is more compact and used in bagged snacks and in candy confections because it doesn’t crumble. 

In 2017, the last year for which data exist, there were 1,051 popcorn farms in the United States spanning more than 221,000 acres. In comparison, there were 304,801 farms (84.7 million acres) that grow corn for grain and 20,784 sweet corn farms (496,096 acres). Popcorn is grown in most states, with Nebraska harvesting the most crop, 368.62 million pounds shelled, in 2017. Indiana (352.39 million), Ohio (129.76 million), Illinois (93.29 million), and Missouri (46.84 million) round out the top 5 states. Together, they represent 92.5% of popcorn harvested that year. Almost all popcorn production in the U.S. is contracted with processors. Leading global ready-to-eat popcorn manufacturers include The Hershey Company, Conagra Brands Inc., Snyder’s-Lance Inc., Intersnack Group GmbH & Co. KG, PepsiCo, Eagle Family Foods Group LLC, Propercorn, Quinn Foods LLC, The Hain Celestial Group Inc., and Weaver Popcorn Company Inc.

Most of the popcorn consumed around the world is produced in the United States but popcorn is also grown in other parts of North America, South America, Europe, Australia, and South Africa. More than 80% of popcorn produced in the U.S. is consumed domestically. In the ready-to-eat segment, North America held 31.23% of the market in 2018. Consumers’ preference for convenience and a variety of flavors will spur demand through at least 2026. In the United Kingdom, 90% of popcorn sold in supermarkets is ready-to-eat, with most of the kernels sourced from the U.S., France, and Italy and then popped in the UK. The Asia-Pacific region’s market share is expected to increase the fastest over this time period as a growing preference for this type of snack and greater awareness of popcorn’s health benefits will create higher demand in the region.  

In 2018, the household segment claimed 53.23% of the market; commercial claimed the rest. With health departments shuttering movie theaters and other entertainment venues because of the coronavirus pandemic, the household segment is expected to dominate the market in 2020. In the United States, the ready-to-eat popcorn segment1 at retail amounted to $1.49 billion of the overall $26.7 billion salty snack market in the 52 weeks ended May 17, 2020, a 5% increase from the same period a year before. Although sales have been increasing in the last 5 years, the increases have been getting smaller. In 2015, this segment’s sales increased by 18.17%; In 2019, 4.1%. While the ready-to-eat segment has been increasing, the microwave segment has been declining year over year. Except in 2020. After declining an average of 3.39% from 2015 to 2019, sales jumped 13.3% in 2020 as more people stayed home with their families and binged watched favorite movies and TV shows. Raw kernel sales also saw a spike in sales. The convenience of ready-to-eat popcorn, which many may have reached for when life was busier, was eclipsed by the comfort of warm, home-popped, buttery (or sweet and savory) popcorn as people’s lifestyles slowed down dramatically.

1 Includes caramel corn.

Sources: “Global Ready-to-Eat Popcorn Market is Expected to Reach USD 6.22 Billion by 2026: Fior Markets,” GlobeNewswire, March 3, 2020 available online here; 2017 Census of Agriculture, United States Department of Agriculture, National Agricultural Statistics Service, April 2019 available online here; “Popcorn Statistics and Facts,” See California available online here; Romy Schafer, “Ready to Eat Popcorn Thrives: State of the Industry 2015,” Snack Food & Wholesale Bakery, July 15, 2015 available online here; Douglas J. Peckenpaugh, “Snack Market Overview: State of the Industry 2016,” Snack Food & Wholesale Bakery, July 11, 2016 available online here; Liz Parker, “State of the Industry 2017: Popcorn Offers More Choices for Consumers,” Snack Food & Wholesale Bakery, July 18, 2017 available online here; Melissa Kvidahl Reilly, “State of the Industry 2018: Ready-to-Eat Popcorn Tops Other Varieties,” Snack Food & Wholesale Bakery, July 17, 2018 available online here; Ed Finkel, “State of the Industry 2019: Popcorn Delivers on Healthy and Indulgent Options,” Snack Food & Wholesale Bakery, July 19, 2019 available online here; Ed Finkel, “State of the Industry 2020: Popcorn Sales Explode,” Snack Food & Wholesale Bakery, July 17, 2020 available online here; “Popcorn Profile,” United States Department of Agriculture, Agricultural Marketing Resource Center, October 2018 available online here; “Popcorn: Ingrained in America’s Agricultural History,” United States Department of Agriculture, National Agricultural Library, Special Collections Exhibits available online here; “Popcorn Facts,” Popcorn Boss available online here; Key Facts About Popcorn in the UK,” SNACMA available online here; John Balint, “Popcorn 101: Butterflies, Snowflakes & Mushrooms (Oh My!),” Popcornopolis, November 11, 2015 available online here; “Popcorn Quotes,” Goodreads available online here;
Image source: John R Perry, “popcorn-candy-food-sweet-dessert-463660,” Pixabay, October 8, 2014 available online here. Use of image does not constitute an endorsement.

Spices

cumin plant, spices
Flowers of the cuminum cyminum (cumin) plant. Cumin is the most popular spice in the world.
Geographic reference: World
Year: 2019 and 2027
Market size: $5.86 billion and $9.70 billion, respectively

I went into the garden in the morning dusk,
When sorrow enveloped me like a cloud;
And the breeze brought to my nostril the odor of spices,
As balm of healing for a sick soul.
— Moses ibn Ezra

What comes to mind when you hear the word “spice”? In autumn, the first thing that may come to mind is “pumpkin spice” and the warmth of cinnamon, nutmeg, ginger, cloves, and allspice. The smell of spices can be evocative, bringing back memories of a place visited, a beloved family recipe, or a special meal enjoyed with friends and family around the dinner table. Today’s market size shows worldwide revenues for spices in 2019 and projected for 2027.

Spices have been used as far back as 5000 B.C.E. Throughout the millennia they’ve been used as medicine and to promote health as well as to flavor and preserve food. They’ve been highly valued as trade goods for thousands of years. The spice trade developed around 2000 B.C.E. on the Indian subcontinent with cinnamon and pepper and in East Asia with herbs and pepper. Egyptians used spices for embalming. Their demand for exotic herbs and spices helped fuel global trade. Alexandria became the main trading center as Indonesian merchants traveled around China, India, the Middle East, and the east coast of Africa and Arab merchants traveled through the Middle East and India. 

During the Middle Ages, spices were among the most expensive and highly demanded products in Europe. They became status symbols and signs of luxury among the wealthiest citizens. Spiced wine was popular. The most common spices in demand were black pepper, cinnamon, cumin, nutmeg, ginger, and cloves. Explorers to the New World brought back allspice, capsicum peppers, and vanilla. By 1700, the importance of spices began to wane as Europeans preferred coffee, chocolate, and tobacco. The United States entered the spice trade in the latter part of the 18th-century trading salmon, codfish, tobacco products, flour, soap, candles, butter, cheese, and beef for spices. Salem, Massachusetts profited tremendously from the Sumatra pepper trade. Most of the pepper was re-exported to Europe or sent for processing and distribution to Philadelphia, Boston, and Baltimore. By the mid-1800s an overproduction of spices and the Civil War brought an end to the pepper trade. More recently, pepper shortages have raised prices in many parts of the world.

Spices are seeds, dried fruits, roots, and barks. They’re mostly used to add flavor, aroma, and color to foods. They’re also used in medicines, dyes, cosmetics, and perfumes. The most popular spice in the world is cumin. In the United States, cinnamon, ginger, and black pepper are the most popular. Powdered spices claimed more than 50% of global revenues in 2019 owing to their versatility and long shelf life. They also don’t have to be refrigerated. However, increasingly consumers are preferring whole spices to provide fresher flavors to their food. This segment of the market is expected to grow the fastest from 2020 to 2027. There has been a rising demand for ready-to-cook spice mixes also both for home use and in the foodservice industry. These save busy consumers time when preparing meals at home and provide a consistent flavor profile in recipes. Newer mixes that provide aromatic and fusion flavors are becoming more popular as people seek out more exotic foods. Demand for spices is also expected to increase as spice manufacturers advertise on social media platforms such as Facebook, Pinterest, and Twitter encouraging people to try various spices in recipes at home.

Many spices have antioxidants, substances that protect cells from damage. Some doctors and dietitians advocate adding spices to one’s diet to get added health benefits. Some people incorporate cinnamon into their diet to lower blood pressure, turmeric to fight inflammation, ginger to relieve nausea, cayenne (capsaicin) to ease pain, cumin to boost the immune system, and garlic for heart health and to lower cholesterol and triglycerides. In traditional medicine, black cumin has been used to treat asthma, diabetes, hypertension, fever, inflammation, bronchitis, dizziness, eczema, and gastrointestinal disturbances.

Studies on the health effects of spices generally focus on spices in the form of supplements although some doctors caution against taking commercial spice supplements that have not been independently verified by a third-party organization because they’re not regulated and may not contain what they say they do. Several spices are currently being investigated in preclinical, clinical, and therapeutic trials as new treatments for several diseases, including cancer. Perhaps in the future new spice-based drugs will be developed.

The Asia Pacific region is a leading producer and exporter of spices garnering more than a 35% revenue share in 2019. Most spices are grown in India, Vietnam, China, and Thailand, with China being one of the largest consumers of spices in the region. Over the last few years, Indian spices have seen a surge in demand worldwide. Leading spice manufacturers include Ajinomoto Co. Inc., Associated British Foods plc, Ariake Japan Co. Ltd., Baria Pepper, Kerry Group, The Bart Ingredients Co. Ltd., DS Group, Everest Spices, Dohler Group, and McCormick & Company Inc.

Sources: “Spices Market Size, Share & Trends Analysis Report by Product (Pepper, Turmeric), by Form (Powder, Whole, Chopped & Crushed), by Region (North America, Europe, APAC, CSA, MEA), and Segment Forecasts, 2020 – 2027,” Grand View Research Report Summary, October 2020 available online here; “Spices Market Size Worth $9.70 Billion by 2027 | CAGR: 6.5%: Grand View Research, Inc.,” CISION PR Newswire, October 12, 2020 available online here; “Spice,” Wikipedia, October 13, 2020 available online here; “The Most Used Herbs Across the Globe,” Urban Cultivator available online here; “History of the Spice Trade,” History & Special Collections, UCLA Louise M. Darling Biomedical Library, 2002 available online here; Alexander Yashin, Yakov Yashin, Xiaoyan Xia, and Boris Nemzer, “Antioxidant Activity of Spices and Their Impact on Human Health: A Review,” Antioxidants, September 15, 2017 available online here; “5 Spices With Healthy Benefits,” Johns Hopkins Medicine available online here; Krishnapura Srinivasan, “Cumin (Cuminum cyminum) and Black Cumin (Nigella Sativa) Seeds: Traditional Uses, Chemical Constituents, and Nutraceutical Effects,” Food Quality and Safety, Oxford Academic, March 2018 available online here; “Seasoning and Spices Market Size, Share & Trends Analysis Report by Product (Herbs, Salt & Salts Substitutes, Spices), by Application, by Region, and Segment Forecasts, 2020 – 2027,” Grand View Research Report Summary, July 2020 available online here.
Image source: Herbolario Allium, “Cuminum cyminum,” Wikimedia Commons, May 1, 2012, available online here. Creative Commons License CC BY 2.0.

Coconut Milk Powder

coconut milk
Geographic reference: World
Year: 2019 and 2027
Market size: $52.5 million and $113.0 million, respectively
Sources: “Coconut Milk Powder Market Size, Share & Trends Analysis Report by Product (Organic, Conventional), by Application (B2B, B2C), by Distribution Channel (Offline, Online), by Region, and Segment Forecasts, 2020 – 2027,” Grand View Research Report Summary, June 2020 available online here; “Coconut Milk Powder Market Size Worth $113.0 Million by 2027 | CAGR 10%: Grand View Research, Inc.,” CISION PR Newswire, June 16, 2020 available online here; Boriana Slabakova, “The Age of Veganism,” Health Careers Blog, January 7, 2020 available online here.
Image source: Adapted from: Tijana Drndarski, “Raw Coconut Products, Coconut Flakes and Coconut Milk,” Pixabay, May 2, 2020 available online here.

Sixty-five percent of the global population is lactose intolerant, including 90% of the people in the Asia-Pacific region. In addition, the rise in health consciousness coupled with the rise in veganism has consumers worldwide seeking dairy alternatives. As of January 2020, the global market for dairy alternatives totaled $18.12 billion, a 144.9% increase from $7.4 billion in 2010. Plant-based milk constitutes 13% of the entire milk market and more than 50% of the vegan food market. Coconut milk powder is one type of dairy alternative that is expected to see significant growth in the near future.

Today’s market size shows coconut milk powder revenues for 2019 and projected for 2027. For consumers who like to buy in bulk and for those that cannot buy liquified coconut milk on a regular basis, coconut milk powder, with its long shelf life, is a convenient alternative. For many cultures such as Brazilian, Burmese, Indian, Thai, Indonesian, Hawaiian, Singaporean, Sri Lankan, and Vietnamese among others, it is considered a staple of their cuisine. Because of this, the Asia-Pacific region held a third of the market in 2019.

Commercially, coconut milk powder is used to prepare smoothies, shakes, ice creams, cakes, donuts, sauces and gravies. The growing demand for vegan ice cream and desserts at dine-in hotels and quick-service restaurants is expected to contribute to growth in the business-to-business (B2B) sector. In 2019, more than 66% of sales were in the B2B segment. The business to consumer segment is expected to have the fastest growth rate, a compound annual growth rate of 10.7% from 2020 to 2027.

Conventional coconut milk powder was the first type to be introduced to the market. In 2019, it claimed more than 70% of revenues. While it is more economical than the organic variety, organic coconut milk powder revenues are expected to grow the fastest through 2027 due to increased demand for organic products in general, products without chemical fungicides, herbicides, or insecticides and grown in an eco-friendly way.

Most manufacturers are small, catering to local markets. Some larger manufacturers include Nestlé Inc., Anthony’s Goods, BareOrganics, Bramble Berry Inc., Dr. Ben Kim Natural Health Solutions, Enerhealth, Grace Foods Canada Inc., Healthworks, King Arthur Flour Company Inc., and KOS.

Enzymes

enzymes in laundry detergent
Laundry detergent. Enzymes in laundry detergent allow clothes to be washed in cold water.
Geographic reference: World
Year: 2019 and 2027
Market size: $9.9 billion and $17.2 billion, respectively
Sources: “Enzymes Market Size, Share & Trends Analysis Report by Application (Industrial Enzymes, Specialty Enzymes), by Product (Carbohydrase, Proteases, Lipases), by Source, by Region, and Segment Forecasts, 2020 – 2027,” Grand View Research Report Summary, March 2020 available online here; “Enzymes Market Size Worth $17.2 Billion by 2027 | CAGR 7.1%: Grand View Research, Inc.,” CISION PR Newswire, March 16, 2020 available online here; Sindhu Raveendran, et. al., “Applications of Microbial Enzymes in Food Industry,” Food Technology & Biotechnology, March 2018 available online at the U.S. National Library of Medicine, National Institutes of Health here; JanMaarten van Dijl and Michael Hecker, “Bacillus Subtilis: From Soil Bacterium to Super-secreting Cell Factory,” Microbial Cell Factories, January 14, 2013 available online here; “A Global Fermentation Approach,” Leaf by Lesaffre available online here; “Specialty Enzymes Market Worth $6.6 Billion by 2025,” MarketsandMarkets Press Release, April 20, 2020 available online here.
Image source: habelfrank, “washing-powder-detergent-1500058,” PIxabay, July 7, 2016 available online here.

Enzymes are proteins that act as catalysts. Enzymes in the body run cellular processes and convert food to energy and to building blocks for proteins, lipids, nucleic acids, and some carbohydrates. Industrial enzymes such as proteases, amylases, lipases, and others are used in various applications: in the food and beverage industry, in detergents, animal feed, biofuels, textiles, pulp and paper, nutraceuticals, personal care products and cosmetics, wastewater treatment, and medications. In 2018, 60% of industrial enzymes on the market were proteases. In Europe, 900 tons of protease enzymes are used for detergents alone every year.

Today’s market size shows the global enzyme revenues for 2019 and projected for 2027. Microorganism-based enzymes comprised the vast majority of the industrial enzyme market in 2019, about 85%, followed by animal-based and plant-based enzymes. Microorganisms are preferred as a source due to their more predictable and controllable enzyme content. This type of enzyme can also be produced in a cost-effective manner with less space and time necessary than animal-based or plant-based enzymes. There are three types of microorganism-based enzymes: bacterial, fungal, and yeast. Bacterial enzymes are mostly sourced from Bacillus. They’re used in food and detergent and in pharmaceutical applications to diagnose diseases, promote wound healing, and kill disease-causing microorganisms. Fungal enzymes are used in the preparation and production of soy sauce, beer, baked goods, processed fruits, and dairy products. Yeast is used in beer, baked goods, and industrial ethanol production.

Increased investment in biotechnology research for the development of specialty enzymes for medicinal and diagnostic purposes is one of the main factors driving product demand globally. Increasing demand from the food and beverage, biofuel, animal feed, and home cleaning sectors along with the growing consumption of functional foods will contribute to the growth in the market through 2027. By region, growing biofuel production in North America and Europe, as well as increasing meat production in Europe and the Russian Federation, are expected to contribute to growth in these regions. Enzymes are used extensively in meat processing to improve the tenderness of the meat. Europe was third behind China and North America in meat production in 2018. The top three companies in this industry—Novozymes, DuPont Danisco, and DSM— claimed more than 75% of the market in 2019.1 Other major companies in this industry include BASF SE, Associated British Foods PLC, Chr. Hansen Holding A/S, and Advanced Enzyme Technologies.

1 Source: Grand View Research. The press release from CISION PR Newswire mentioning the same Grand View Research report states that the top 3 companies are Novozymes, DuPont Danisco, and BASF SE.

Rose Oil

rose oil infused cream

Rose oil, as the name implies, is oil from the rose plant, specifically oil extracted from rose petals. Typically it takes 3,000 grams of rose petals to extract one gram of rose oil. Because of this, it is expensive. Damask rose, cabbage rose, and the white rose of York are the most common varieties from which the oil is extracted. These varieties have strong aromas and have high oil content. Damask rose is commonly grown in Bulgaria, Syria, Turkey, Russia, Pakistan, India, Uzbekistan, Iran, and China. Cabbage rose grows in Morocco, France, and Egypt. The white rose of York has been cultivated in Europe for hundreds of years.

Today’s market size shows the total global revenues for rose oil in 2018 and projected for 2025. This product is used in fragrances, cosmetics, pharmaceuticals, food, and beverages. The fragrance and cosmetics sectors combined constituted 70.1% of the market in 2018. Consumer demand for natural and organic products will fuel growth in this industry as manufacturers replace synthetic ingredients with natural ones. Rose oil’s antimicrobial and anti-bacterial properties are expected to continue to interest the pharmaceutical sector increasing demand for the product.

Europe had the largest share of the market, by value, in 2018, 40.2%. Europe is also the largest market for natural fragrance ingredients. The Asia Pacific region is expected to have the highest compounded annual growth rate, 8.0%, between 2018 and 2025 due to rising sales of pharmaceutical products overall in China, Australia, India, and Japan. The use of herbal medicines to treat various skin conditions in this region is expected to increase demand for this oil also. Some top manufacturers include Sigma-Aldrich, Inc.; Ernesto Ventos SA; Alteya Organics, LLC; Givaudan SA; and Firmenich International SA; among others.

Geographic reference: World
Year: 2018 and 2025
Market size: $278.7 million and $442.0 million, respectively
Sources: “Rose Oil Market Size, Share & Trends Analysis Report by Application (Fragrance & Cosmetics, Pharmaceuticals, Food & Beverages), by Product (Organic, Conventional), and Segment Forecasts, 2019 – 2025,” Grand View Research Press Release, September 2019 available online here; “Rose Oil Market Size Worth $442.0 Million by 2025 | CAGR: 6.8%: Grand View Research, Inc.,” Cision PR Newswire Press Release, September 12, 2019 available online here; “Rose Oil,” Wikipedia, August 2019 available online here; Cathy Wong, “The Health Benefits of Rose Oil,” VeryWell Health, September 4, 2019 available online here; “Rosa x alba,” Wikipedia, June 2019 available online here.
Original source: Grand View Research
Image source: silviarita, “flower-rose-cream-petal-skin-care-3141777,” Pixabay, Feburary 9, 2018 available online here.

Acerola Extracts

Acerola

Acerola is a cherry-like fruit native to South America, southern Mexico, Puerto Rico, Dominican Republic, Haiti, Brazil, and Central America. It’s also grown in Texas, Florida and the subtropical areas of Asia. Traditionally the fruit has been used to treat liver ailments, diarrhea, dysentery, coughs, and colds. Acerola contains high levels of vitamin C; therefore, it is also used to treat or prevent scurvy. Because the fresh berries and the juice made from them spoil easily, acerola is most often found in supplement form: capsules, chewables, liquid extracts, and powder.

Acerola fruit is also high in vitamin A, B1, B2, B3, carotenoids, and bioflavonoids. Because of this, its extract is used as an additive in functional foods. Functional foods are modified foods that claim health benefits beyond their traditional nutritional value. Globally in 2018, functional food sales totaled $153.6 billion. By 2025 sales are forecast to grow to $260.4 billion, creating a growing market for these extracts.

In addition to its use as a food supplement, acerola extract is used as a food preservative in packaged food, snacks, beverages, confectionery, and meat. Consumers around the world are incorporating more prepackaged convenience foods in their diet. At the same time, consumers desire healthy foods made from natural sources. In response to this, the market for acerola extracts for food preservation is expected to grow. However, this growth will be tempered due to the high cost of acerola extract compared to artificial preservatives. Overall, the market for acerola extracts is projected to grow at a compounded annual growth rate of 8.2% from 2018 to 2026.

Today’s market size shows the global sales of acerola extracts in 2017. Acerola extracts in powdered form provided most of the revenue in 2017 and are expected to continue to dominate the market through 2026. Some major manufacturers of these extracts include Amway, Blue Macaw Flora, Diana Naturals, Duas Rodas Industrial, Herbal Bio Solutions, Nature’s Power Nutraceuticals Corp. Naturex, Nichirei Corporation, NutriBotanica, Optimally Organic Inc., and The Green Labs LLC.

Geographic reference: World
Year: 2017
Market size: $8.68 billion
Sources: “Acerola Extract Market – Global Industry Analysis, Share, Size, Trends, Growth and Forecast to 2026,” Reuters Plus, December 4, 2018 available online here; “Malpighia emarginata,” Wikipedia, August 2019 available online here; “What Is Acerola Cherry?” Healthline available online here.
Image source: Zaiane Sá, “Acerolas,” Wikimedia Commons, [CC BY-SA 4.0], March 26, 2016 available online here. The editors did not make changes to the photo.

Hemp

Hemp seeds

Hemp, a variety of the cannabis plant, is a widely cultivated herb grown for its edible seeds, oil, and strong woody fiber used in cordage and fabrics. Unlike marijuana, modern-day hemp contains very small concentrations of the psychoactive substance delta-9-tetrahydrocannabinol (THC), less than 0.3%. Marijuana, on the other hand, typically contains between 5% and 20%, with some types containing up to 35%. Hemp contains higher concentrations of cannabidiol (CBD), however, than marijuana. CBD is the ingredient in cannabis thought to have medicinal properties. The Federal Drug Administration in the United States recently approved the CBD-derived epilepsy drug Epidiolex. Of all the products made from hemp sold in the U.S. in 2017, consumers spent the most on hemp-derived CBD, $190 million. One of the top food trends in 2019 is expected to be CBD-infused food and drinks, increasing demand. Spending on hemp-based industrial products totaled $144 million in 2017, much of which was spent by the automotive industry.

Hemp has been cultivated for thousands of years. Its fibers were found in pottery dating back more than 5,000 years in what is modern-day Taiwan. Textiles made of hemp were used in China as far back as 4000 BC and hemp paper was first used in 100 BC. The first recorded use of cannabis as medicine was in 2737 BC. In the 1500s, hemp was used for sailcloth for the English Navy. Because of this, English farmers and later farmers in the North American colonies were required to devote some acreage to hemp cultivation. The variety of cannabis that was grown in the American colonies was Cannabis sativa, an imported variety, not the indigenous hemp known to Native Americans. The plants were grown in tight clusters, thereby creating a taller plant with fewer branches and fewer female flowers. It’s the female flowers that contain high concentrations of THC. In the 18th-century, hemp was made into clothes, rope, bed ticking and sacks. During the American Revolution, it was in high demand for ropes and sails for the Continental Navy as well as for the state-sponsored fleets. Demand for it waned after the war but remained a flourishing domestic cash crop in the United States. After the Marihuana Tax Act of 19371 was implemented, which also taxed and regulated hemp, the popularity of hemp declined and many businesses shuttered. In the middle of the 20th century, calls for the prohibition of marijuana due to its intoxicating effects led to cannabis being banned in the Federal Comprehensive Drug Abuse Prevention and Control Act of 1970 signed by Richard Nixon. No provision was made to exempt industrialized hemp grown for utilitarian purposes.

As the tide of public opinion toward cannabis turned and more and more states started to legalize medical marijuana, hemp was again looked at as a viable domestic crop. The Agricultural Act of 2014, signed by President Obama, defined industrialized hemp as separate from marijuana and authorized research and pilot programs for the production of hemp in conjunction with universities and state departments of agriculture. In 2015, seven states planted research crops. Twenty-seven states removed barriers to hemp production and Colorado, Oregon, and Vermont licensed farmers to grow hemp under state law. Unfortunately, Federal law still classified hemp as a Schedule I substance so farmers could still go to jail and have their property taken away for growing hemp. This changed with the Agriculture Improvement Act of 2018, also known as the 2018 Farm Bill, that President Trump signed into law in December 2018. This law amended the Controlled Substances Act to exempt the THC in hemp from being classified as a Schedule I drug, opening up opportunities for farmers to grow and sell industrialized hemp in the United States without the worry of losing their property or going to prison due to Federal drug policy.

Today’s market size shows the total sales of hemp products in the United States in 2017 and 2022 according to Hemp Business Journal estimates. *Future estimates vary widely among different groups when it comes to the largest sales category in the hemp industry, CBD-based products. Marijuana research firm Greenwave Advisors predicts that CBD product sales alone will reach $3 billion by 2021. Cannabis industry analysts at the Brightfield Group predict that sales will reach $22 billion by 2022. These higher estimates are bolstered by many factors, not the least of which is the signing of the 2018 Farm Bill into law. Also, products containing CBD are now more widely available, being sold at health food stores and in beauty aisles of mainstream retailers. More doctors are prescribing CBD products for conditions such as post-traumatic stress disorder (PTSD), anxiety, multiple sclerosis, and chronic pain. The Federal Drug Administration’s approval of Epidiolex will also fuel demand. An estimated $591 million was spent on hemp-based CBD products in 2018. Demand is expected to grow as consumers continue to seek natural remedies for ailments.

1 “Under pertinent provisions of the Marihuana Tax Act, 26 U.S.C.S. §§ 4751-4753, every person who sells, deals in, dispenses, or gives away marihuana must register with the Internal Revenue Service and pay a special occupational tax.” Also, a transfer tax was required to be paid and a form was to be filled out with the name and address of the buyer and seller and the amount of marihuana to be purchased. The form was to be filled out in triplicate, one copy going to the Internal Revenue Service, one copy to be kept by the buyer and the original to be kept by the seller. All copies and originals were subject to inspection by federal and state law enforcement. Source: “Marijuana Tax Act Law and Legal Definition,” USLegal available online here.

Geographic reference: United States
Year: 2017 and 2022
Market size: $820 million and $1.9 billion*, respectively
Sources: “The U.S. Hemp Industry Grows to $820mm in Sales in 2017,” Hemp Business Journal, May 20, 2018 available online here; “Hemp,” Merriam-Webster available online here; “The Truth Behind Hemp in the United States,” Ministry of Hemp available online here; Ben Swensen, “Hemp & Flax in Colonial America,” Colonial Williamsburg Journal, Winter 2015 available online here; “10,000- year History of Marijuana Use in the World,” Advanced Holistic Health available online here; Elisabeth Garber-Paul, “Exclusive: New Report Predicts CBD Market Will Hit $22 Billion by 2022,” Rolling Stone, September 11, 2018 available online here; Public Law No: 115-334. Agriculture Improvement Act of 2018 available online here; Daniele Piomelli and Ethan B. Russo, “The Cannabis sativa Versus Cannabis indica Debate: An Interview with Ethan Russo, MD,” Cannabis and Cannabinoid Research, US National Library of Medicine, National Institutes of Health, January 1, 2016 available online here; Brian S. Julin, “Welcome to Frequently Asked Questions About Cannabis Hemp,” 1994 available online here; “Titles II and III of the Comprehensive Drug Abuse Prevention and Control Act of 1970 (Public Law 91-513)” available online here; “Hemp vs Marijuana,” Ministry of Hemp available online here; “Marijuana Tax Act Law and Legal Definition,” USLegal available online here; Trevor Hughes, “It Won’t Get You High, But It Can Make You Full,” USA Today for the Lansing State Journal, January 14, 2019, page 1B.
Image source: ulleo, “hemp-cannabis-seeds-grains-healthy-2258608,” Pixabay, April 28, 2017 available online here.

Meat Substitutes

Meat substitutes soy medallions cauliflower potatoesIn the 2000s, documentaries attempted to expose the animal welfare, environmental, and economic impacts related to large-scale industrial farming. More recently, studies have been published linking the decreased consumption of meat and the increased consumption of fruits, vegetables, and whole grains to lower death rates, reduced production of greenhouse gases, and healthcare-related savings. According to a study published in PNAS, adopting global dietary guidelines such as these could reduce deaths by 5.1 million by 2050, reduce greenhouse gas emissions by nearly one-third, and save $700-1,000 billion per year in healthcare costs. The Global Burden Disease study, led by the Institute for Health Metrics and Evaluation, found that six of the top 10 risk factors for early death worldwide were linked to a poor diet. Researchers concluded that a diet high in red meat and sugary drinks and low in fruit, vegetables, and whole grains contributed to 30.8 million deaths, or 21% of the global population in 2013, up from 25.1 million in 1990.

According to GlobalData, 70% of the world’s population is either reducing their consumption of meat or eschewing meat altogether. In the United States alone, the percentage of people who describe themselves as vegan jumped six-fold from 2014 to 2017. In Great Britain, the number of people identifying as vegan jumped 350% over the past decade. In Portugal, the number of vegetarians increased 400% over the same time period. Faced with increased obesity, Type-2 diabetes, and heart disease in their populations, countries such as Canada and China have proposed or implemented new nutrition guidelines calling for their citizens to eat a plant-rich diet. In the past 30 years, China’s meat consumption has quadrupled; however, China’s new food guidelines encourage its population to halve their meat consumption by 2030.

In 2017, 26% of consumers in the United States reported reducing their meat consumption in the past 12 months and 36% reported buying plant-based meat substitutes. According to a California Walnut Board study, 83% of Americans would be interested in making meatless recipes if the taste and texture would be similar to meat-centric dishes. According to Chuck Jolley, president of the Meat Industry Hall of Fame, the popularity of plant-based meat substitutes is one of the six biggest challenges for animal agriculture in 2018 as more of these products are sold in mainstream grocery stores and restaurants. Whether people are concerned about animal welfare, environmental issues or their health, the percentage of people giving up meat completely is quite small. Of the countries mentioned above, in the United States, 6% of the population identifies as vegan; in Great Britain, 3.25%;1 and in Portugal, 0.6%. Of course, not all consumers of meat substitutes are vegetarians or vegans. According to Beyond Meat’s executive chairman, Seth Goldman, 70% of consumers who purchase their Beyond Burger2 product are flexitarians, meat eaters who are reducing their meat consumption.

Today’s market size shows the global sales of meat substitutes in 2017 and projected for 2018, 2023 and 2025. Real meat will continue to have a place at the table in most households around the world. Global sales of meat substitutes were a small fraction of the $90 billion real meat market in 2017.

1 Figure is for 2016.
2 Mention of the company and its product does not constitute an endorsement.

Geographic reference: World
Year: 2017, 2018, 2023 and 2025
Market size: $4.2 billion, $4.6 billion, $6.4 billion and $7.5 billion respectively
Sources: Zlati Meyer, “Missouri Is First State to Regulate the Word ‘Meat’,” USA Today for the Lansing State Journal, August 29, 2918, page 3B; “Plant-Based Diets Could Save Millions of Lives and Dramatically Cut Greenhouse Gas Emissions,” March 21, 2016 available online here; Madlen Davies, “Poor Diet Is the Biggest Cause of Early Death Across the World – With Red Meat and Sugary Drinks Responsible for One in Five Deaths,” Daily Mail, October 6, 2016 available online here; Becky Schilling, “The Future of Plant-Based Foods,” Supermarket News, September 21, 2017 available online here; Michael Pellman Rowland, “Millennials Are Driving The Worldwide Shift Away From Meat,” Forbes, March 23, 2018 available online here; “Why the Global Rise in Vegan and Plant-Based Eating Isn’t a Fad (600% Increase in U.S. Vegans + Other Astounding Stats),” Food Revolution Network, January 18, 2018 available online here; Chris Bennett, “Flesh and Blood: What’s the Future of Fake Meat?” Drovers, August 13, 2018 available online here; Elaine Watson, “An Estimated 70% of Beyond Burger Fans Are Meat Eaters, Not Vegans/Vegetarians, says Beyond Meat,” FoodNavigator-USA.com, January 12, 2018 available online here; Chuck Jolley, “Six Greatest Ag Challenges for 2018,” Feedstuffs, December 6, 2017 available online here; “Vegan Society Poll,” Ipsos MORI, May 16, 2016 available online here; “Number of Vegetarians in Portugal Rises by 400 Percent in 10 Years,” The Portugal News Online, December 10, 2017 available online here.
Original source: Figures for 2017 and 2025 are from Allied Market Research.
Image source: Kalhh, “cauliflower-potato-soy-medalions-943005,” Pixabay, September 17, 2015 available online here.

Fatty Amides

Plastic food packagingFatty amides, organic compounds derived from fatty acids, are used as slip agents and anti-blocking agents in polyolefin film processing. They’re added to the polymer from which the film is made. When the film is pressed, the fatty amides come to the surface and decrease the coefficient of friction between the film and the machine rollers to aid in the processing of the film. The fatty amides also prevent the layers from sticking together so that the rolls of film can be more easily unwound for further processing. Erucamide, oleamide, stearamide, and behenamide are the most commonly used fatty amides. Oleamide is widely used in food packaging and as a dispersing agent in printing inks and dyes. Erucamide had the largest share of the fatty amide market in 2016. It’s used as a slip agent, anti-fogging agent, and lubricant for polyolefin films used in food packing.

Today’s market size shows the total worldwide sales of fatty amides in 2017 and projected for 2022. The increasing demand for bio-based products, as opposed to petroleum-based products, is expected to fuel growth in this industry in the next 5 years. However, price volatility is expected to impede this growth during this time period. The market for fatty amides in the Asia-Pacific region is expected to grow the fastest due to the rising population and increased demand for packaged foods.

Geographic reference: World
Year: 2017 and 2022 projected
Market size: $320.7 million and $391.5 million
Sources: “The Fatty Amides Market Size Will Grow From USD 320.7 Million in 2017 to USD 391.5 Million by 2022, at a CAGR of 4.07%,” CISION PR Newswire, March 8, 2018 available online here; “Fatty Amides Market,” Global Market Study on Fatty Amides: Increasing Demand from Film & Sheets Industry to Drive Growth of Market During the Forecast Period 2016 – 2022, Persistence Market Research Press Release, March 2016 available online here; Kenneth J. Longmoore and Edward K. Bullock, “Slip Agents and Polypropylene Films Prepared Therefrom,” United States Patent, No. US 6,497,965 B1, December 24, 2002 available online here.
Image source: ToddTrumble, “green-beans-plastic-bag-vegetable-1377124,” Pixabay, May 11, 2016 available online here.

Food Fortification Ingredients

Fortified foods, cereal and milk
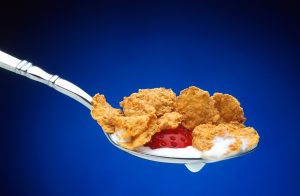
Fortified foods, such as iodized salt and vitamin-D fortified milk, originally addressed nutrient deficiencies in the general public. Some countries currently mandate the addition of folic acid to enriched flour to reduce the risk of neural tube birth defects. Most food fortification is voluntary but regulated by government entities in countries where the food is sold along with the European Food Safety Authority and the World Health Organization. The United States, for example, does not allow the fortification of fresh produce, meat, poultry or fish products. European countries do not allow fortification of unprocessed foods. Fortification of snack foods is also discouraged.

Food fortification ingredients include vitamins, minerals, probiotics, prebiotics, carbohydrates, proteins and amino acids. These added ingredients can be found in a wide variety of foods from juices, bread, and cereals to infant formula and pet food. Fortification indicates the addition of nutrients at levels higher than those naturally occurring in the food.

Today’s market size shows the value of food fortification ingredients in 2016 and 2025. The figure for 2025 is projected. The food fortification market is expected to grow at a compounded annual growth rate of 14.5% between 2017 and 2025 as consumers increasingly look for foods that provide additional health benefits beyond basic nutrition, such as omega-3 fortified foods for heart health and probiotics for digestive health.

Geographic reference: World
Year: 2016 and 2025 projected
Market size: $30.50 billion and $100.84 billion respectively
Sources: “2017 Global Food Fortification Ingredients – Market Size, Market Share, Application Analysis, Growth Trends, Key Players and Competitive Strategies (2015-2025) – ResearchAndMarkets.com,” Business Wire press release, February 23, 2018 available online here; “Food Fortification in Today’s World,” International Food Information Council Foundation, June 20, 2014, last updated December 29, 2015 available online here; “Food Fortification Ingredients Market Report 2017-2027,” Visiongain, June 15, 2017 available online here.
Image source: skeeze, “cereal-spoonful-strawberry-spoon-556786,” Pixabay, December 9, 2014 available online here.

Coffee Cafes

Coffee cafeAccording to the National Coffee Association’s 2017 National Coffee Drinking Trends report, 62% of Americans drink coffee on a daily basis and 46% of coffee consumed is done so away from home. Although the recent popularity of coffee cafes may be traced back to the 1990s when Starbucks expanded across the country, TV show friends were seen hanging out at Central Perk coffeehouse, and laptops and wi-fi allowed workers to work from anywhere, coffee cafes are nothing new. The first public place to serve coffee dates back to 1475 in Constantinople, Turkey (now Istanbul).

Today’s market size shows the total sales of coffee cafe chains in the United States in 2016. The top three coffee cafe chains, in terms of sales, are Starbucks (estimated $14.7 billion, accounting for nearly 60% of the total sales at coffee cafe chains in the U.S.), Dunkin’ Donuts ($8.2 billion), and Tim Hortons (estimated $760 million).

Geographic reference: United States
Year: 2016
Market size: $24.8 billion (a 9.7% increase from 2015)
Sources: “Coffee Cafe,” Restaurant Business, June 2017, page 55 available online here; Paajanen, Sean, “The Evolution of the Coffee House,” The Spruce, November 27, 2016 available online here; Mock, Brentin, “What Made Coffeehouse Culture Go Boom?” CityLab, January 23, 2017 available online here; Auffermann, Kyra, “From Brew Boomers to the Gourmet Generation: National Coffee Drinking Trends 2017,” The First Pull, National Coffee Association, March 28, 2017 available online here; DeRupo, Joe, “Daily Coffee Consumption Up Sharply,” National Coffee Association News Release, March 25, 2017 available online here.
Original source: Technomic’s Top 500 Chain Restaurant Report
Image source: Free-Photos, “coffee-shop-american-flag-america-1081713,” Pixabay, January 7, 2016 available online here.

Specialty Limited-Service Restaurants

Krispy Kreme restaurantA limited-service restaurant is one in which customers choose, order and pay for their food ahead of time. The food can be eaten in the restaurant, taken out, or delivered. Specialty limited-service restaurants specialize in one type of meal or menu item. Today’s market size shows the total sales at these types of restaurants. The top three specialty limited-service restaurants in terms of sales in 2016 were Krispy Kreme (estimated $758 million), Dickey’s Barbeque Pit (estimated $557.6 million), and Auntie Annie’s ($547.9 million).

Geographic reference: United States
Year: 2016
Market size: $6.9 billion
Source: “Specialty LSR,” Restaurant Business, June 2017, page 52 available online here.
Original source: Technomic’s Top 500 Chain Restaurant Report
Image source: GoToVan, “Krispy Kreme in Delta (14865312212).jpg,” Wikimedia Commons, August 9, 2014, CC-BY-2.0 license available online here. Use of image does not constitute endorsement of brand.

Canadian Icewine Exports

Canadian icewineThe Canadian winemaking industry goes back more than 200 years to the early 1800s when Johann Schiller began growing hybridized grapes and making his own wine in Ontario’s Niagara region. The first commercial winery opened in 1866 on Pelee Island. In 1890 there were 41 commercial wineries in Canada, most in Ontario. By 2011 there were 476. Four years later that number grew to 604. Domestic sales of Canadian wines in 2015-2016 were C$2.1 billion. Exports were valued at nearly C$74 million in 2015.

Icewine, a dessert wine that is made exclusively from grapes that are naturally frozen on the vine, began to be produced commercially in Canada in 1978. In 1991 Inniskillin Winery’s 1989 Vidal Icewine won the Grand Prix d’Honneur at Bordeaux’s VinExpo, bringing international recognition to Canada’s icewine industry. Currently, Canada is the largest consistent producer of icewine in the world.

Today’s market size shows the value and volume of Canadian icewine exports in 2011 and 2015. More than a third of icewine exports went to China in 2015, followed by the United States (23.5%), South Korea (13.2%), the United Kingdom (6.5%), and Hong Kong (6.1%). In all in 2015 Canada exported icewine to 31 countries around the world. Although the value and volume of icewine exports have increased during the 2011 to 2015 time period, as a percentage of total wine exports, the value and volume have decreased. In 2011, icewine was 36.2% of total wine export value; in 2015, 25.1%. In 2011, icewine made up 0.84% of total wine exports by volume. In 2015, that dropped to 0.32%.

Geographic reference: Canada
Year: 2011 and 2015
Market size: C$13,354,174 and C$18,623,057 respectively
Market size: 181,093 liters and 234,604 liters respectively
Sources: “Canadian Icewine Exports 2011-2015,” Canadian Vintners Association, August 2016 available online here; “Canadian Icewine Exports – Top 10 Markets in 2015,” Canadian Vintners Association, August 2016 available online here; “Canadian Wine Exports 2011-2015,” Canadian Vintners Association, August 2016 available online here; Statistics Canada, “Table 183-0024 – Sales of Alcoholic Beverages of Liquor Authorities and Other Retail Outlets, by Value, Volume, and Beverage Type, Annual,” CANSIM, May 1, 2017 available online here; “Key Dates & Statistics,” Robert A Bell’s Wines of Canada available online here; “Canadian Icewine,” Canadian Vintners Association, 2016 availalble online here; “The Beginning of Wine Making in Canada,” Robert A Bell’s Wines of Canada, 2014 available online here; “History of Icewines,” Robert A Bell’s Wines of Canada, 2012 available online here; “Industry Statistics,” Canadian Vintners Association available online here; “Canadian Wine and Grape Industry Economic Impact 2015 Fact Sheet,” Canadian Vintners Association, March 2017 available online here.
Image source: Hatfield, Craig, “Icewine From The Niagara Region,” Wikimedia Commons, February 2, 2008 available online here. Use of image does not constitute endorsement of brand shown.

Craft Beer in Michigan

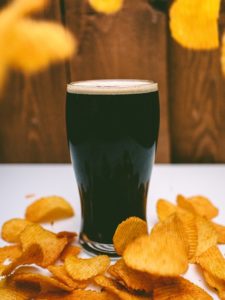
From 2012 to 2016, the number of craft breweries in the United States more than doubled from 2,420 to 5,234. In 2016, sales of craft beer made up 22%—$23.5 billion—of the overall beer market.

Today’s market size shows the number of craft breweries in Michigan and the number of gallons of beer they produced in 2016.

Geographic reference: Michigan
Year: 2016
Market size: 205 craft breweries produced 769,897 gallons of craft beer
Sources: Dillon Davis, “Standing Tall,” Lansing State Journal, April 23, 2017, page 3P; “Number of Breweries,” 2017 available online here.
Original source: Brewers Association
Image source: Tookapic, “Beer-glass-drink-beverage-alcohol-932320,” Pixabay, September 28, 2015 available online here.

Wineries in Michigan


Michigan ranks fifth in the United States in wine production. Most wine grapes are grown in Van Buren, Berrien, Leelanau, and Grand Traverse counties, all within 25 miles of the Lake Michigan coast. The top 3 wines produced are Riesling, Pinot Noir, and Chardonnay. Because several other types of fruit are grown in the state, many wineries make wine from fruit other than grapes, such as with cherries or apples.

Geographic reference: Michigan
Year: 2017
Market size: 127 wineries producing 2.4 million gallons of wine annually
Source: Bob Gross, “Wine and Spirits Industries Booming,” Lansing State Journal, April 23, 2017, page 7P.
Original source: Michigan Grape and Wine Industry Council

Sake

Sake is an alcoholic beverage, made with rice, that originated in Japan. It is often referred to as rice wine but is actually closer to a beer than a wine based on the way that it is brewed. In the production of wine, the natural sugars in the fruits from which it is made are fermented. In making sake, the sugars that are fermented to produce the alcohol must first be converted from the starches in rice. It is a process very similar to the one used to brew beer.

Today’s market size is the value of Japanese sake exports to the world in 2002, 2012 and the industry’s declared goal for exports by 2020. In 2012, one-third of the sake exported from Japan was imported by the United States.

Geographic reference: Japan
Year: 2002, 2012, and a forecast for 2020
Market size: ¥7.5 billion, ¥8.9 billion and ¥60 billion respectively. In dollar terms, based on average exchange rates each year and using 2013’s exchange rate for the 2020 forecast, those values are $60 million, $112 million, and $616 million.
Source: Eric Peanner and Zhiyi Yang, “In Sake, Japan Sees A Potential Stimulus,” The New York Times, February 22, 2014, pages B1-B2. The average exchange rate data used to convert the Yen to Dollars was obtained at this OzForx Group Limited website.
Original source: National Tax Agency of Japan
Posted on March 11, 2014

Bourbon

The last decade has been one of unexpected growth for whiskey distillers in the United States and in particular for those producing bourbon. Bourbon is made in the United States only—in the same way that Scotch Whiskey must be made in Scotland—and is a type of whiskey made from a grain mash consisting of at least 51% corn mash. The distinctions that define types of whiskey are the primary grain used in the mash with which the whiskey is distilled, the length of time it is aged in a barrel, and the place in which it is made.

Bourbon whiskey was a very fashionable and popular drink in the United States after prohibition and through the 1950s. The drink went out of fashion in the 1960s and spent the next several decades in decline. But that has all changed since the turn of the century. Bourbon is once again a fashionable drink, demand for which is rising so quickly that distillers are having a hard time keeping pace. After all, a high-quality bourbon must spend years in a barrel to age making quick adjustments to inventory problematic.

Today’s market size is the value of bourbon exports from the United States in 2002 and 2013.

Geographic reference: U.S. exports
Year: 2002 and 2013
Market size: $376 million and $1 billion respectively
Source: Clay Risen, “The Billion-Dollar Bourbon Boom — How Did American Bourbon Get So Damn Hot?” Fortune, February 24, 2014, pages 56-65.
Original source: Distilled Spirits Council of the United States
Posted on March 4, 2014

Oranges

Today’s market size is the total production of oranges worldwide in 2013, broken out into those harvested for consumption as fresh fruit and those harvested for processing. In the United States, production was down in 2013 due in part to Citrus Greening disease which has been killing trees in the nations largest orange producing state, Florida. Over the last six years, 2008–2013, U.S. orange production accounted for an average of 15% of world production. In 2013 that figure fell to 13%.

Geographic reference: World
Year: 2013
Market size: 51.8 million metric tons, 59% harvested for fresh consumption and 41% for processing
Source: “Oranges, Fresh: Production, Supply and Distribution in Selected Countries,” Production, Supply and Distribution Online, December 24, 2013, USDA, Foreign Agricultural Service, available online here. The USDA reports on the production and supply of many agricultural products through its Foreign Agricultural Service, the main web site for which is here.
Original source: U.S. Department of Agriculture, Foreign Agricultural Service (FAS)
Posted on February 7, 2014

Craft Cider

red_apples_on_tree_193814

Sales in the United States of hard cider tripled between 2007 and 2012. Hard cider is a fermented alcoholic beverage made with fruit juice, usually apple but some ciders are made with other fruit juices, primarily peach and pear. When the term cider is used alone, it may refer to hard cider or to a nonalcoholic apple cider.

Although the hard cider market is still a small fraction of the $10.2 billion craft beer market (2012) it is growing quickly. Cider sales in multi-outlets and convenience stores during the year ended March 24, 2013, totaled $122.5 million for the top 20 cider brands. That’s an increase of 97 percent compared to a year earlier. Capitalizing on the craft cider trend, small and large craft beer manufacturers are creating their own hard cider blends to entice drinkers with new taste offerings. To spark interest in the mainstream beer drinker MillerCoors offers several hybrid beers.

Today’s market size is total sales of hard cider in the United States in 2012.

Geographic reference: United States
Year: 2012
Market size: $600 million
Source: Chris Furman, “Craft Cider Gaining Momentum,” Brewhound, June 3, 2013, available online here. The photo is from a web site offering images free of copyright, here.
Posted on January 24, 2014

Cranberries

Cranberries, a native fruit of North America, are consumed most frequently in the form of juice. However, during the celebration of Thanksgiving in the United States, cranberries in a more solid form have an important place on the menu. Wisconsin is the cranberry-producing center of the United States. It’s crop, in 2012, accounted for more than half of all fresh cranberries sold in the country.

Today’s market size in the estimated value of the 2012 cranberry harvest in the United States.

We wish you much to be thankful for on this day before Thanksgiving, 2013.

Geographic reference: United States
Year: 2012
Market size: $386 million (slightly more than 8 million barrels of cranberries)
Source: Malinda Geisler and Diane Huntrods, “Cranberries Profile,” Agricultural Marketing Resource Center (AgMRC), Iowa State University, available online here.
Original source: U.S. Department of Agriculture
Posted on November 27, 2013