Pumpkins

specialty pumpkins
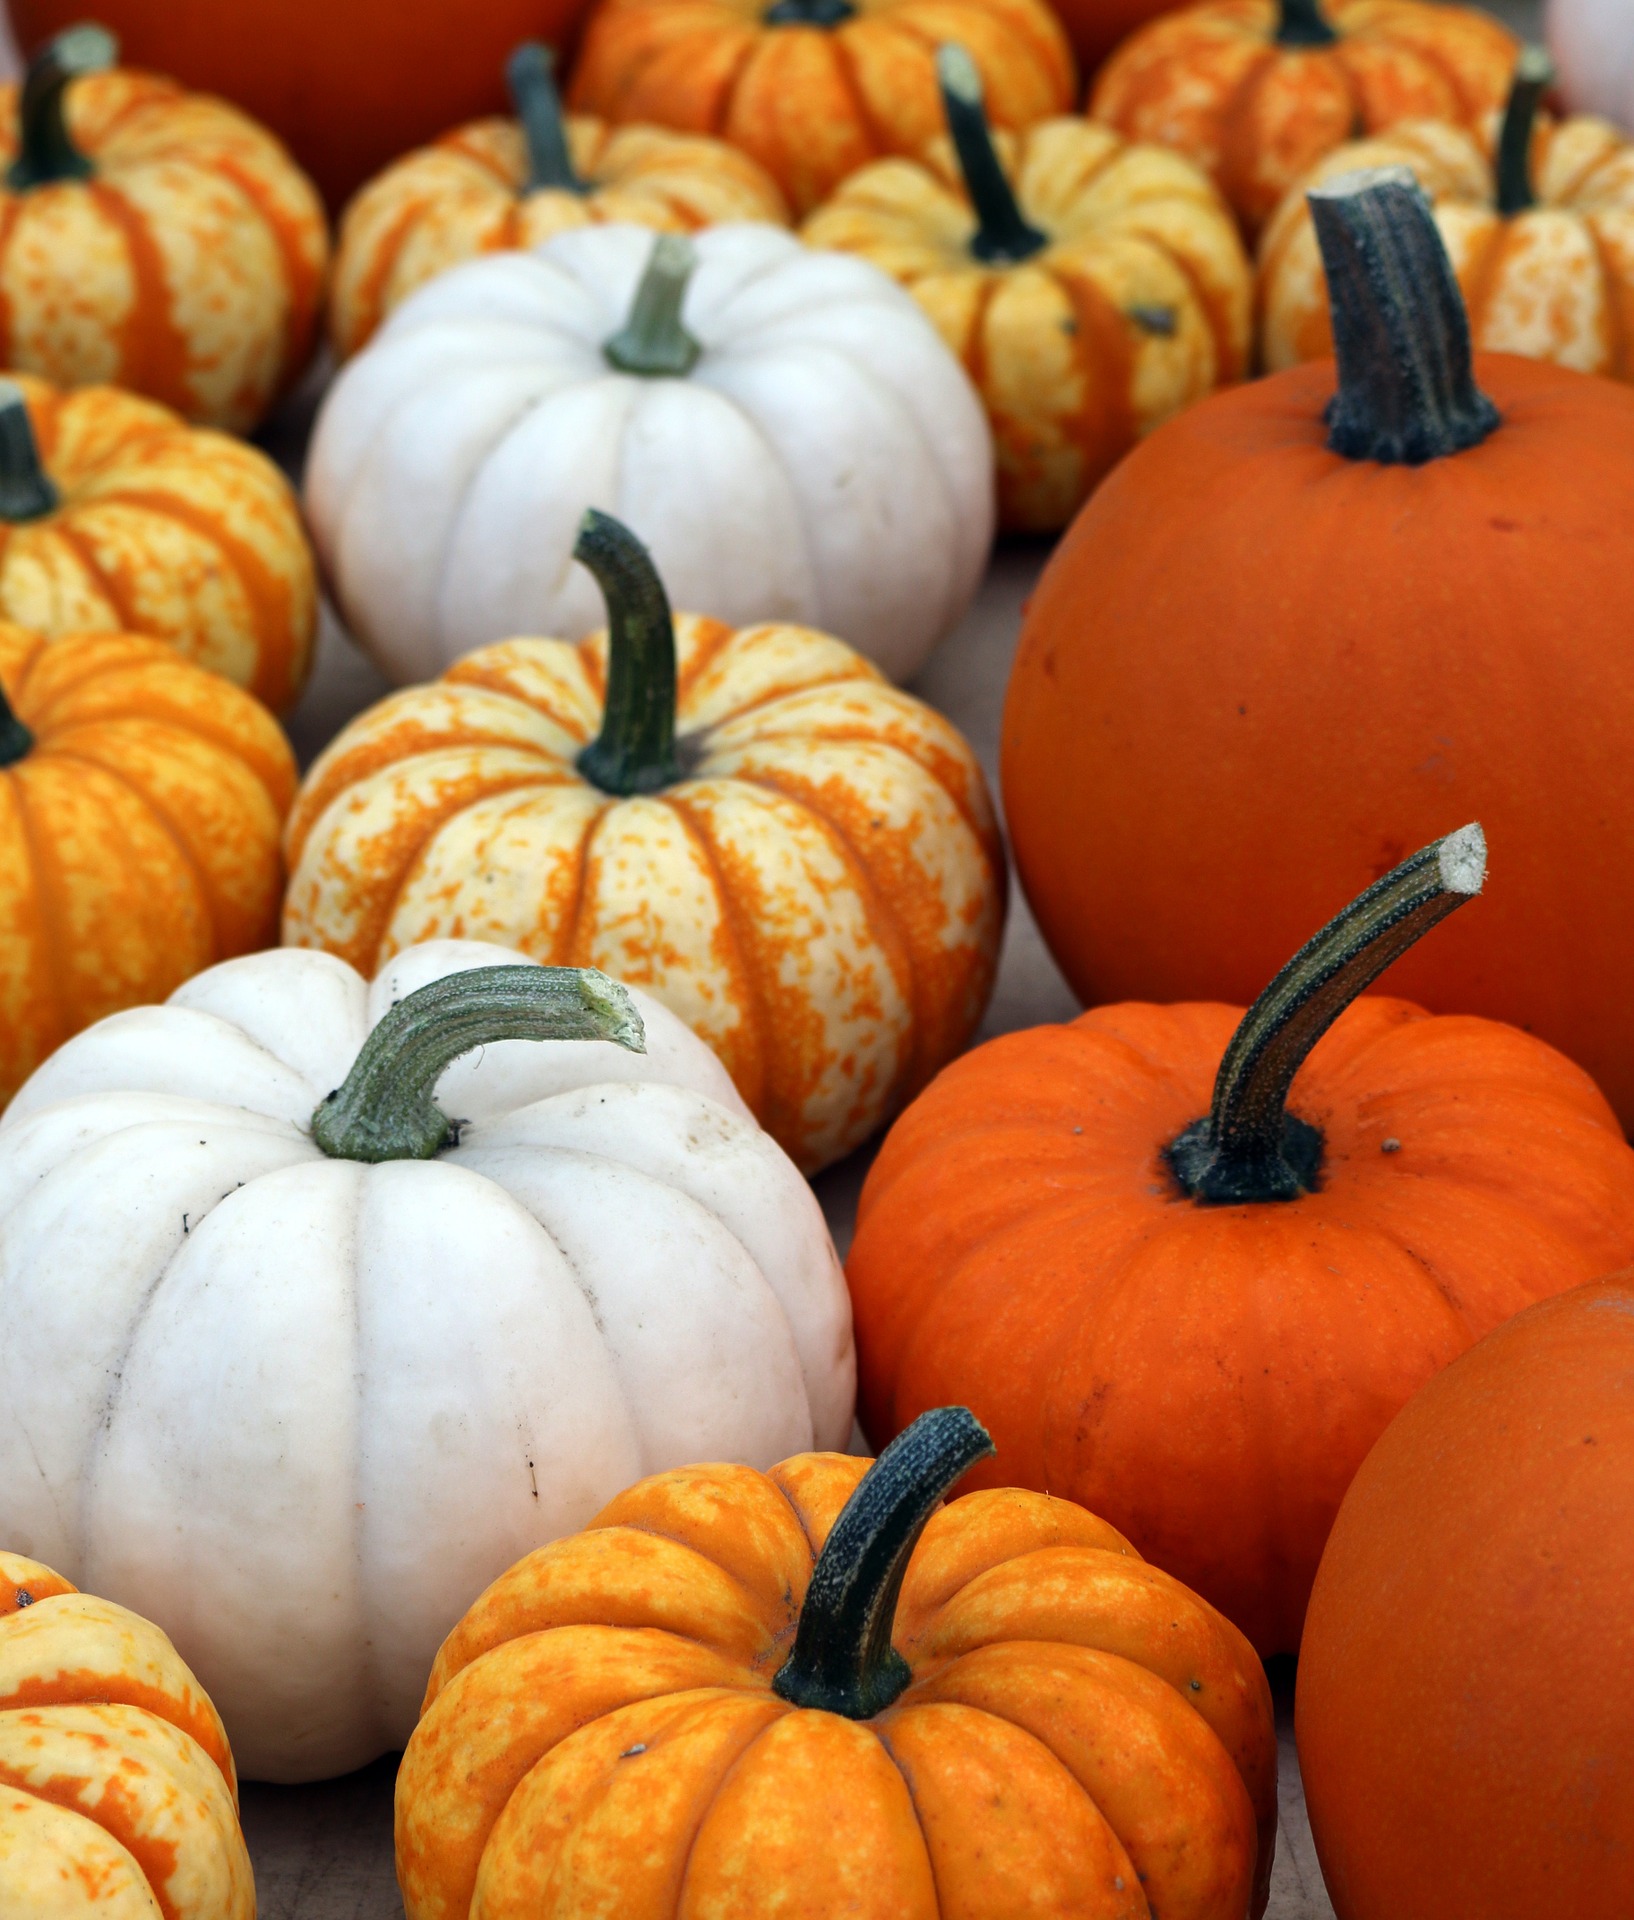
Pumpkins. The quintessential autumn vegetable. Carved into jack-o-lanterns for Halloween. Baked into pies for Thanksgiving and Christmas. Used as a flavoring in everything from coffee and creamers to ice cream, beer, and rum. In the 52 weeks ended August 25, 2018, pet parents spent more than $109 million for pumpkin-flavored dog food, a 124% jump from the previous 52-week period. For several years now pumpkin has been the most popular Halloween costume for pets.

Today’s market size shows the total production value of pumpkins in the United States in 2017. That year, growers harvested 69,340 acres, down from 71,400 acres in 2016, but well above the 45,900 acres a decade ago. The production value of pumpkins for the fresh market was $172.1 million in 2017, far above the $13.6 million for pumpkins harvested for processing. In acres harvested, the top 5 states were Illinois, Ohio, Indiana, California, and New York. Nearly 80% of Illinois’ pumpkin harvest is grown for processing.

In recent years the demand for specialty and heirloom pumpkin varieties has grown. Some popular varieties include Big Mac, Blue, Cotton Candy, Valenciano, Festival, Cinderella and Fairytale. The Cotton Candy and Valenciano varieties have a white hue. The Fairytale variety turns a shade of mahogany when mature. The Cinderella, so named because of its resemblance to Cinderella’s transformed coach, is a French heirloom variety that was cultivated by the Pilgrims.

Geographic reference: United States
Year: 2017
Market size: $185.8 million
Sources: “Quick Stats,” United States Department of Agriculture, National Agricultural Statistics Service available online here; Ana Serafin Smith, “Halloween Spending to Reach $9 Billion,” National Retail Federation Press Release, September 20, 2018 available online here; “Pumpkin Spice Sales Growth Makes a Hot Return in Late-August” available online here; “Pumpkins: Background & Statistics,” United States Department of Agriculture, Economic Research Service, September 13, 2018 available online here; “Historical Highlights and Related Releases,” National Retail Federation available online here; Tess Koman, “55 Fall-Flavored Things You Can Eat Right Now,” Delish, September 12, 2018 available online here; Lizzie Fuhr, “8 Funky Pumpkin Varieties for a Festive Fall,” PopSugar, October 5, 2012 available online here.
Image source: Renee_Olmsted_Photography, “pumpkins-halloween-stems-autumn-956428,” Pixabay, September 25, 2015 available online here.

Meat Substitutes

Meat substitutes soy medallions cauliflower potatoesIn the 2000s, documentaries attempted to expose the animal welfare, environmental, and economic impacts related to large-scale industrial farming. More recently, studies have been published linking the decreased consumption of meat and the increased consumption of fruits, vegetables, and whole grains to lower death rates, reduced production of greenhouse gases, and healthcare-related savings. According to a study published in PNAS, adopting global dietary guidelines such as these could reduce deaths by 5.1 million by 2050, reduce greenhouse gas emissions by nearly one-third, and save $700-1,000 billion per year in healthcare costs. The Global Burden Disease study, led by the Institute for Health Metrics and Evaluation, found that six of the top 10 risk factors for early death worldwide were linked to a poor diet. Researchers concluded that a diet high in red meat and sugary drinks and low in fruit, vegetables, and whole grains contributed to 30.8 million deaths, or 21% of the global population in 2013, up from 25.1 million in 1990.

According to GlobalData, 70% of the world’s population is either reducing their consumption of meat or eschewing meat altogether. In the United States alone, the percentage of people who describe themselves as vegan jumped six-fold from 2014 to 2017. In Great Britain, the number of people identifying as vegan jumped 350% over the past decade. In Portugal, the number of vegetarians increased 400% over the same time period. Faced with increased obesity, Type-2 diabetes, and heart disease in their populations, countries such as Canada and China have proposed or implemented new nutrition guidelines calling for their citizens to eat a plant-rich diet. In the past 30 years, China’s meat consumption has quadrupled; however, China’s new food guidelines encourage its population to halve their meat consumption by 2030.

In 2017, 26% of consumers in the United States reported reducing their meat consumption in the past 12 months and 36% reported buying plant-based meat substitutes. According to a California Walnut Board study, 83% of Americans would be interested in making meatless recipes if the taste and texture would be similar to meat-centric dishes. According to Chuck Jolley, president of the Meat Industry Hall of Fame, the popularity of plant-based meat substitutes is one of the six biggest challenges for animal agriculture in 2018 as more of these products are sold in mainstream grocery stores and restaurants. Whether people are concerned about animal welfare, environmental issues or their health, the percentage of people giving up meat completely is quite small. Of the countries mentioned above, in the United States, 6% of the population identifies as vegan; in Great Britain, 3.25%;1 and in Portugal, 0.6%. Of course, not all consumers of meat substitutes are vegetarians or vegans. According to Beyond Meat’s executive chairman, Seth Goldman, 70% of consumers who purchase their Beyond Burger2 product are flexitarians, meat eaters who are reducing their meat consumption.

Today’s market size shows the global sales of meat substitutes in 2017 and projected for 2018, 2023 and 2025. Real meat will continue to have a place at the table in most households around the world. Global sales of meat substitutes were a small fraction of the $90 billion real meat market in 2017.

1 Figure is for 2016.
2 Mention of the company and its product does not constitute an endorsement.

Geographic reference: World
Year: 2017, 2018, 2023 and 2025
Market size: $4.2 billion, $4.6 billion, $6.4 billion and $7.5 billion respectively
Sources: Zlati Meyer, “Missouri Is First State to Regulate the Word ‘Meat’,” USA Today for the Lansing State Journal, August 29, 2918, page 3B; “Plant-Based Diets Could Save Millions of Lives and Dramatically Cut Greenhouse Gas Emissions,” March 21, 2016 available online here; Madlen Davies, “Poor Diet Is the Biggest Cause of Early Death Across the World – With Red Meat and Sugary Drinks Responsible for One in Five Deaths,” Daily Mail, October 6, 2016 available online here; Becky Schilling, “The Future of Plant-Based Foods,” Supermarket News, September 21, 2017 available online here; Michael Pellman Rowland, “Millennials Are Driving The Worldwide Shift Away From Meat,” Forbes, March 23, 2018 available online here; “Why the Global Rise in Vegan and Plant-Based Eating Isn’t a Fad (600% Increase in U.S. Vegans + Other Astounding Stats),” Food Revolution Network, January 18, 2018 available online here; Chris Bennett, “Flesh and Blood: What’s the Future of Fake Meat?” Drovers, August 13, 2018 available online here; Elaine Watson, “An Estimated 70% of Beyond Burger Fans Are Meat Eaters, Not Vegans/Vegetarians, says Beyond Meat,” FoodNavigator-USA.com, January 12, 2018 available online here; Chuck Jolley, “Six Greatest Ag Challenges for 2018,” Feedstuffs, December 6, 2017 available online here; “Vegan Society Poll,” Ipsos MORI, May 16, 2016 available online here; “Number of Vegetarians in Portugal Rises by 400 Percent in 10 Years,” The Portugal News Online, December 10, 2017 available online here.
Original source: Figures for 2017 and 2025 are from Allied Market Research.
Image source: Kalhh, “cauliflower-potato-soy-medalions-943005,” Pixabay, September 17, 2015 available online here.

Organic Food

Organic foodSales of organic food have grown considerably since 1990 when the Organic Food Production Act was signed into law. That law authorized the U.S. Department of Agriculture’s National Organic Program. One of the many responsibilities of this program is to develop standards for organically-produced agricultural products that have the USDA organic seal, ensuring that products meet consistent, uniform standards. These standards, along with the USDA organic seal, were first implemented in 2002. The program also maintains a list of certified organic operations and helps farmers and businesses learn how to get certified. In 2017 there were more than 24,000 certified organic operations in the United States. Between 1990 and 2002 sales of organic food products increased nearly 9-fold, from $1 billion in 1990 to $8.6 billion in 2002. In 2017, sales were more than $45 billion.

While still a small portion of overall food sales, organic food sales growth has outpaced overall food sales growth in each of the last ten years. Sales of organic food grew 17.5% in 2008, the highest growth in the last decade. That same year overall food sales grew 4.9%. In 2008, organic food sales made up 3.1% of all food sales in the country. By 2017, organic food sales grew to 5.5% of total food sales. Growth in the organic food sector that year slowed to 6.4%, but it was still well above the 1.1% growth in the overall food sector.

Fruits and vegetables were the largest organic food category in 2017, with sales of $16.5 billion, followed by dairy and eggs. However, the dairy and egg sector faced competition from the growing popularity of non-dairy milk alternatives and the USDA’s withdrawing of regulations in the Organic Livestock and Poultry Practices rule in 2017, which caused many consumers to question the meaning of the USDA seal on these products, reduced demand. Growth in organic beverage sales outpaced overall organic food sales growth by 64% in 2017. Sales of organic fresh juices alone jumped 25%, reaching $1.2 billion or slightly more than one-fifth of total organic beverage sales that year.

Today’s market size shows the total sales of organic food for the years 2008 and 2017. According to a study conducted by Nielsen, 82% of households in the lower 48 states regularly bought organic food in 2017. This is up considerably from just 3 years earlier when a Gallup poll reported that 45% of households actively try to include organic foods in their diet.

Geographic reference: United States
Year: 2008 and 2017
Market size: $20.4 billion and $45.2 billion respectively.
Sources: Maggie McNeil, “Maturing U.S. Organic Sector Sees Steady Growth of 6.4 Percent in 2017,” Organic Trade Association Press Release, May 18, 2018 available online here; “National Organic Program,” United States Department of Agriculture, Agriculture Marketing Service avalable online here; Nate Birt, “Study: 82% of U.S. Households Buy Organic Food Regularly,” AgWEb, March 24, 2017 available online here; Rebecca Riffkin, “Forty-Five Percent of Americans Seek Out Organic Foods,” Gallup, August 7, 2014 available online here; Laura Batcha, “Organic Farming Has So Many Benefits for People,” Lansing State Journal, July 22, 2018, page 9A.
Image source: ErikaWittlieb, “vegetables-supermarket-market-food-1100198,” Pixabay, December 22, 2015 available online here. Use of image does not constitute endorsement of supermarket shown.

Cranberries

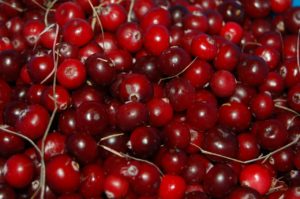
In 1816, cranberries began being commercially cultivated in the United States. Centuries before that Native Americans gathered wild cranberries for food, dye, and medicine. Pemmican—a mixture of cranberries, dried deer meat, and fat tallow that would last for months—provided a reliable source of protein and fat. Pemmican became a food staple of fur traders, essential to their survival on long journeys during the winter.

The colonists used cranberries in recipes they were familiar with from their native countries, substituting cranberries for the sour fruit called for in these recipes. In the 1620s, after the British brought honeybees to North America, a consistent supply of sweetener was available and cranberries began being used in pies, tarts, and cranberry sauce that was mostly eaten with white meats such as turkey. Although the commercial canning of cranberries began in 1912, the canned, gelatinous cranberry sauce that most Americans are familiar with did not become popular until 1940.

In 2012, the last year for which data are available,1 there were a total of 1,040 cranberry bogs and marshes in the United States, down from 1,134 in 2007. However, total acreage increased from 41,310 in 2007 to 43,918 in 2012. Most of the cranberries produced in the United States come from Wisconsin, Massachusetts, New Jersey, Oregon, and Washington State. In 2016, 35% of the cranberries harvested were sold overseas; a decade ago, 10% were. According to Kellyanne Dignan, senior manager of corporate communications at Ocean Spray Cranberries, more than 70% of U.S. shoppers who buy fresh cranberries use them for sauce for a holiday meal.

Today’s market size shows the number of pounds of processed and fresh cranberries sold in 2006 and 2015. Per capita, consumption of fresh cranberries remained flat between 0.08 and 0.10 pounds during this time period. However, processed cranberry consumption reached a high of 1.98 pounds per person in 2006, dropped to a low of 1.67 pounds in 2012, then increased yearly up to 1.93 pounds per person in 2015.

1 2017 data is currently being compiled for the Census of Agriculture by the United States Department of Agriculture. The data will be published starting in February 2019.

Geographic reference: United States
Year: 2006 and 2015
Market size: (Processed cranberry sales) 5,909,755 pounds and 6,203,247 pounds respectively
Market size: (Fresh cranberry sales) 258,454 pounds and 270,229 pounds respectively
Sources: “Report – Per Capita Cranberry Consumption,” U.S. Cranberries, Cranberry Marketing Committee, 2017 available online here; Whitman-Salkin, Sarah, “Cranberries, a Thanksgiving Staple, Were a Native American Superfood,” National Geographic, November 28, 2013 available online here; Blakemore, Erin, “A Brief History of Cranberries,” Smithsonian.com, November 25, 2015 available online here; “Table 40. Berries: 2012 and 2007,” 2012 Census of Agriculture, USDA, National Agricultural Statistics Service, May 2, 2014 available online here; “Cranberries,” United States Department of Agriculture, Economics, Statistics and Market Information System, August 10, 2017 available online here; Offner, Jim, “Marketers See Retail as Sweet Spot for Cranberry Sales,” The Packer, September 2, 2016 available online here; Offner, Jim, “Export Market Continues to Grow for Cranberry Industry,” The Packer, September 4, 2016 available online here; “Frequently Asked Questions,” USDA Census of Agriculture, United States Department of Agriculture, June 16, 2017 available online here.
Image source: alex80, “Cranberries-berry-red-vitamin-1714174,” Pixabay, August 2016 available online here.

Pizza

According to Restaurant.com, Halloween is one of the top 5 busiest days for pizza sales at pizzerias in the United States. The convenience of picking up a ready-made pizza for dinner, or having one delivered, leaves families more free time to prepare for trick-or-treating. In addition, pizza is an often-served and welcome meal at Halloween parties across the country. Forty-one percent of consumers polled for Technomic’s 2016 Pizza Consumer Report said they eat pizza once a week. Two years ago 26% did.

Today’s market size shows total pizza sales at pizzerias in the United States for the year ending September 30, 2016. However, pizza is not only consumed in the United States. Worldwide, pizza sales totaled $128 billion in 2016. The top 3 regions of the world in terms of sales were Western Europe ($47 billion), North America ($45 billion), and Latin America ($13 billion) according to Euromonitor International. Latin America is expected to see a 45% growth in pizza sales through 2020, followed by China (31%) and the Asia-Pacific region (26%).

Geographic reference: United States
Year: Year ending September 30, 2016
Market size: $44 billion
Source: Hynum, Rick, “Pizza Power Report 2017 – A State of the Industry Report,” PMQ, December 2016 available online here; Hobson, Alex, “Halloween is One of the Top Selling Days for Pizzerias,” ABC Action News, WFTS Tampa Bay, October 31, 2013, updated November 1, 2013 available online here.
Original sources: Euromonitor International, CHD Expert, Technomic
Image source: Riedelmeier, “Pizza-stone-oven-pizza-stone-oven-1344720,” Pixabay, March 28, 2016 available online here.

Online Grocery-Delivery Services

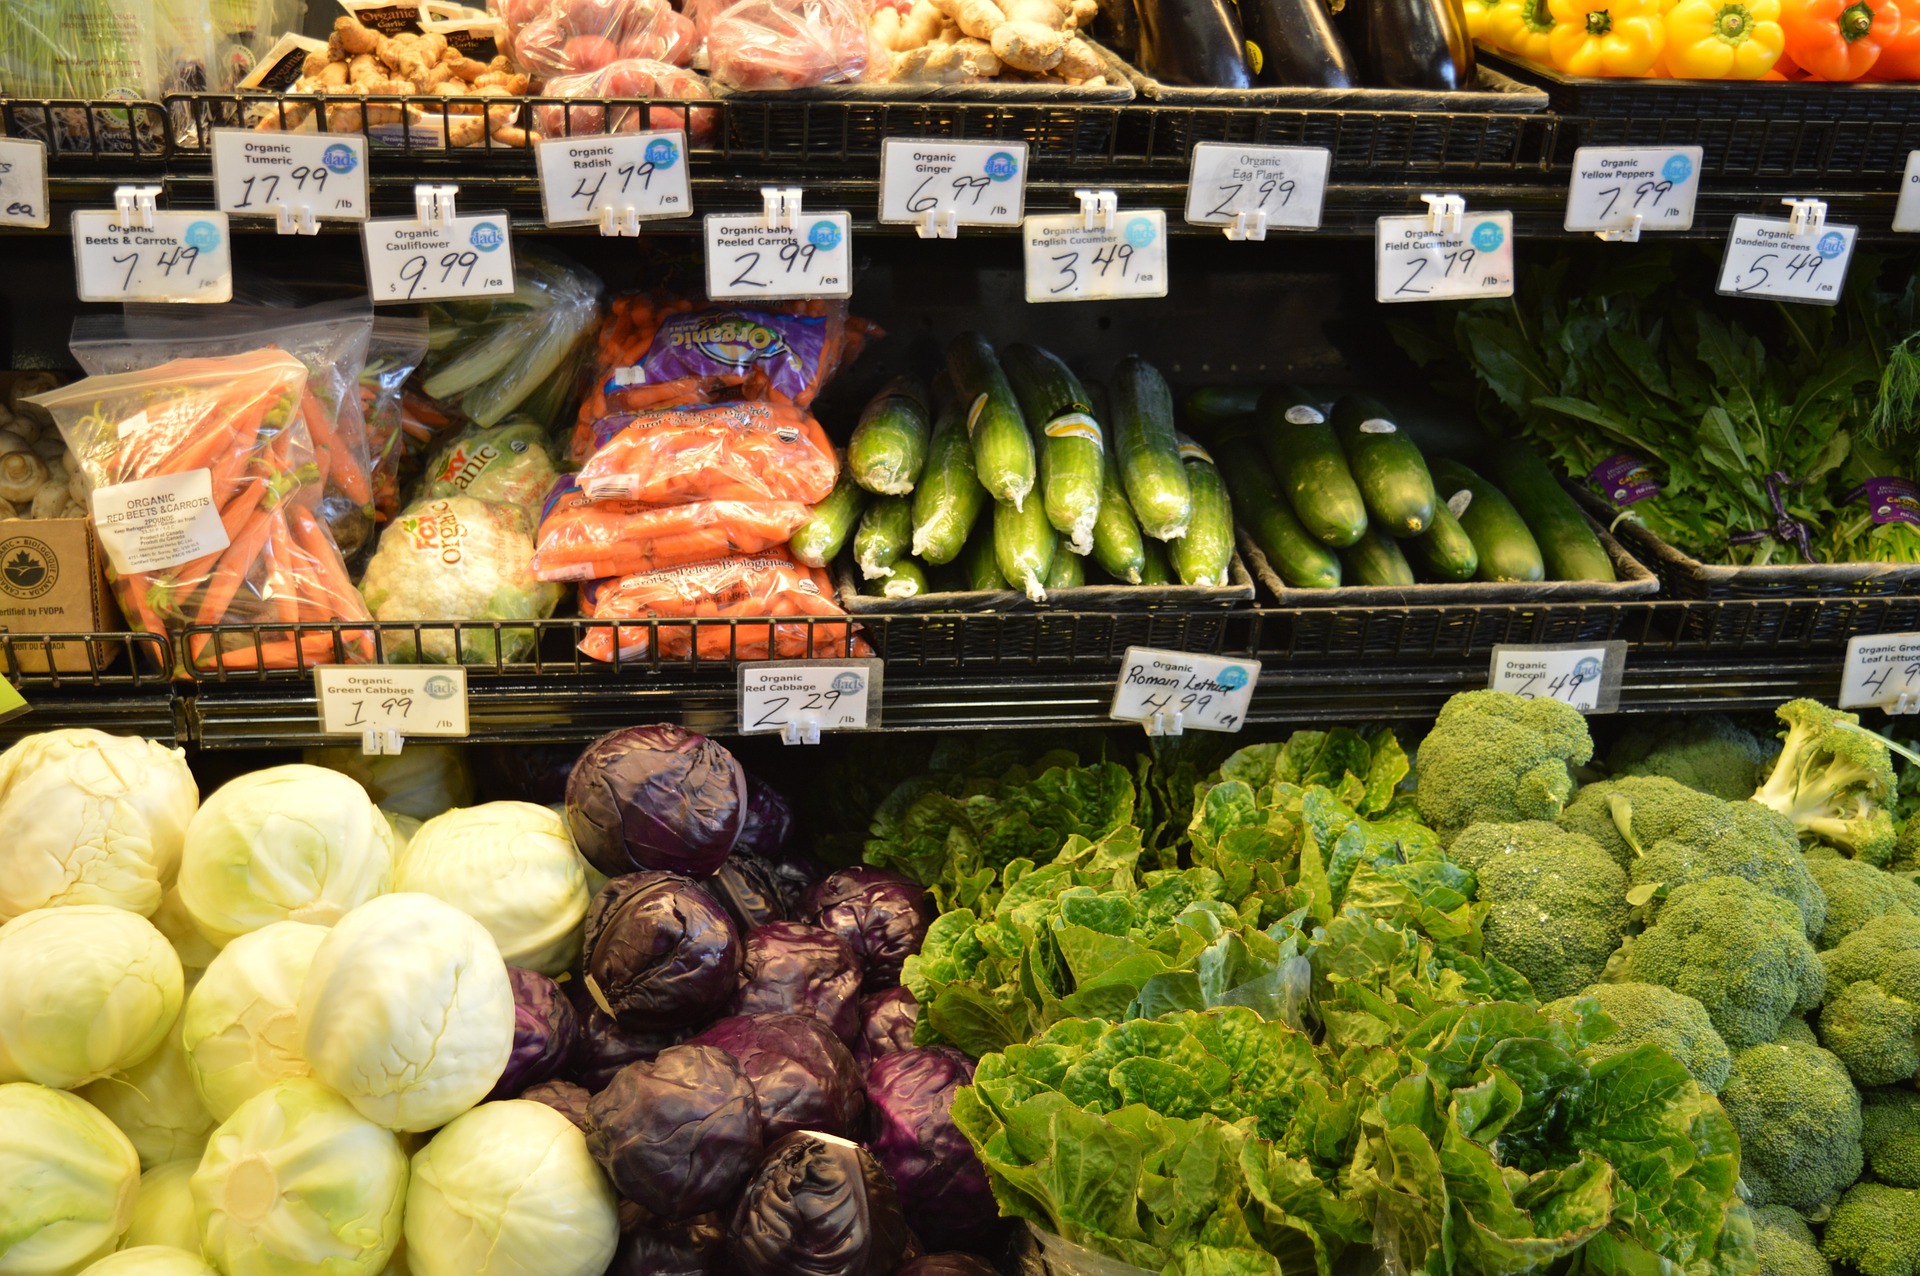
For many years people have been buying books, clothing, and housewares online. Why not groceries? The grocery industry in the United States generates more than $600 billion in sales. Nearly everyone shops for groceries and an overwhelming majority shop for groceries at least once a week. Online grocery-shopping services offer the consumer convenience, but many times this convenience comes at a price. Because the consumer is paying someone else to shop for them, in order to pay these employees companies may charge higher prices for the groceries themselves and charge for shipping or delivery. Also, the consumer has to trust that the online grocery-shopping service employees will select the best produce, meat, and other perishable items and deliver them to their door in a timely manner and in good condition.

Despite many of the drawbacks, consumers are spending billions shopping online for groceries. Today’s market size is the total amount consumers in the United States spent online for groceries in 2016, a more than 160% increase in spending over 2015. Also included are projected sales figures for 2025.

Geographic reference: United States
Year: 2016 and 2025
Market size: $42 billion and more than $100 billion respectively
Sources: Trejos, Nancy, “Hotels Find Alternatives to Room Service,” USA TODAY for the Lansing State Journal, August 14, 2017, page 5B; Kestenbaum, Richard, “Why Online Grocers are So Unsuccessful and What Amazon is Doing About It,” Forbes, January 16, 2017 available online here.
Original source: Morgan Stanley
Image source: JoyintheCommonplace, “List-plan-phone-to-do-list-1474674,” Pixabay, June 23, 2016 available online here. Original image has been modified.

Back-to-College Spending

According to the National Center for Education Statistics fall college enrollment in 2010 was 21.0 million. Enrollment declined to 20.2 million in 2014 but is projected to increase to 20.9 million in 2017. Today’s market size shows the total amount spent on back-to-college items by students and their families in 2010, 2014 and 2017. The figure for 2017 is projected. In 2017, back-to-college shoppers plan on spending the most on electronics ($12.8 billion), followed by clothing ($8.0 billion) and snacks and other food items ($7.5 billion). Spending on dorm and apartment furnishings came in fourth at $5.9 billion. Spending on school supplies ranked seventh at $3.9 billion.

Geographic reference: United States
Year: 2010, 2014 and 2017 projected
Market size: $45.88 billion, $48.48 billion and $54.18 billion respectively
Sources: Smith, Ana Serafin, “Back-to-School and Back-to-College Spending to Reach $83.6 Billion,” National Retail Federation Press Release, July 13, 2017 available online here; U.S. Department of Education, National Center for Education Statistics, “Table 303.10. Total Fall Enrollment in Degree-Granting Postsecondary Institutions, by Attendance Status, Sex of Student, and Control of Institution: Selected Years, 1947 through 2025,” Digest of Education Statistics: 2015, December 2016 available online here.
Original source: Prosper Insights & Analytics

Hot Dogs

The hot dog is a staple at sporting events, picnics, carnivals, and backyard barbecues. According to the National Hot Dog and Sausage Council, Americans consume about 20 billion hot dogs per year. That equates to about 70 hot dogs per person per year, fewer than half of which were bought at retail stores.

Today’s market size is the total retail sales of hot dogs in the United States in 2016.

Geographic reference: United States
Year: 2016
Market size: $2.4 billion
Source: “Consumption Stats,” available online here; “Hot Dog Fast Facts,” available online here.
Original source: National Hot Dog and Sausage Council, The Neilsen Company

Wheat Market in Michigan

Michigan has approximately 8,000 wheat farmers, some have been farming on family farms for more than 100 years. Several have ancestors who were wheat farmers in Europe. Farmers in Michigan plant on average 500,000 acres of wheat per year.

There are primarily two types of wheat that Michigan farmers plant: soft white and soft red. Soft white wheat is mostly used in breakfast cereals and whole-grain products because of its greater palatability. Soft red wheat is mostly used for baked goods and other processed foods.

Today’s market size is the value of wheat sales by farmers in Michigan.

Geographic reference: Michigan
Year: 2016
Market size: $218.5 million
Source: Witsil, Frank, “Dr. Wheat Shapes Eats,” Lansing State Journal, November 13, 2016, page 7A

Animal Feed Additives

Food supplements are consumed, whether by humans or animals, to augment or improve in some way the nutritional value of the diet. Food additives in farming have been used for centuries, as anyone who has seen a salt-lick will appreciate. However, with the rise of corporate farming in livestock production—what are known as Animal Feeding Operations (AFOs)—the use of feed additives and the nature of those additives has changed greatly. Animal feed additives come in a variety of types, from vitamin supplements and amino acids to preservatives, emulsifiers and essential fatty acids.

Recently, one commonly used additive has been in the media spotlight; antibiotics. It is now common practice in the United States to add low doses of antibiotics to animal feed. Antibiotics are used to stimulate growth as well as to stave off the diseases bred by unnatural and unsanitary conditions. The use of antibiotics on livestock is so great in the United Sates that it is believed to account for 80%, by weight, of all antibiotic use. The business of providing a population with high volumes of low-cost meat is a very large business indeed. Raising livestock in more natural ways—as opposed to the assembly-line manner used by AFOs—takes longer and, as they say, time is money.

Today’s market size is the estimated global value of the animal feed additive market. These additives are most heavily used in North America and Asia-Pacific, regions that together account for more than 60% of the use of animal feed additives.

Geographic reference: World
Year: 2012 and a forecast for 2018
Market size: $16.18 billion and $20.23 billion respectively
Source: “Animal Feed Additives Market Worth $20,233.2 Million by 2018,” PR Newswire, March 12, 2014, available online here.
Original source: MarketsandMarkets
Posted on March 17, 2014

Oranges

Today’s market size is the total production of oranges worldwide in 2013, broken out into those harvested for consumption as fresh fruit and those harvested for processing. In the United States, production was down in 2013 due in part to Citrus Greening disease which has been killing trees in the nations largest orange producing state, Florida. Over the last six years, 2008–2013, U.S. orange production accounted for an average of 15% of world production. In 2013 that figure fell to 13%.

Geographic reference: World
Year: 2013
Market size: 51.8 million metric tons, 59% harvested for fresh consumption and 41% for processing
Source: “Oranges, Fresh: Production, Supply and Distribution in Selected Countries,” Production, Supply and Distribution Online, December 24, 2013, USDA, Foreign Agricultural Service, available online here. The USDA reports on the production and supply of many agricultural products through its Foreign Agricultural Service, the main web site for which is here.
Original source: U.S. Department of Agriculture, Foreign Agricultural Service (FAS)
Posted on February 7, 2014

Global Feed Industry

The feed industry is a part of the agriculture sector. The term feed here is used as a noun and refers to the food provided to agricultural animals and fish, to livestock. Many different things are used as feed. These are usually broken into two categories, concentrates and roughage. The concentrates are the high energy value feeds that come from cereal grains, high-protein oil meals, and by-products from processing sugar beets, sugarcane, animals and fish. The category of feed referred to as roughage includes pasture grasses, hay, silage, corn stalks and the like.

An area of interest and research in this industry is raising insects for use as animal feed. It has the potential for being a very sustainable, comparatively low energy way to significantly increase feedstocks over the next decades. This is important since United Nations’ estimates predict a 70% increase in demand for agricultural feed over current rates by the year 2050.

Today’s market size is the quantity and value of feed production globally in 2011.

Geographic reference: World
Year: 2011
Market size: 870 million tons valued at $350 billion
Source: “Insects as Animal Feed,” The Fish Site, June 3, 2013, available online here.
Original source: United National Food and Agriculture Organization (FAO)
Posted on September 20, 2013

Cold Cereal for Breakfast

In recent years makers of cold cereal have seen their revenues drop as more people choose a variety of other options for their first meal of the day. In the second quarter of 2013, Kelloggs reported a 3% drop in sales of cold cereal and General Mills reported a 7% drop. Yogurt, shakes, and on-the-go breakfast bars are popular alternatives to cold cereal. While cold cereal is still the number one choice for breakfast in the United States, yogurt is the second most popular choice with revenues of nearly $7 billion. And within the yogurt market, it is Greek yogurt that has pushed sales skyward for several years now. A novelty just five years ago, Greek yogurt has grown to represent 40% of the yogurt market since then.

Today’s market size is the value of sales of cold cereal in the United States for the year, August 2012 to August 2013.

Geographic reference: United States
Year: August 2012-2013
Market size: $9 billion
Source: Jane Wells, “Cereal Killers: Americans’ New Breakfast Habits,” CNBC, August 23, 2013, available online here.
Posted on August 27, 2013

Açaí Berries and Superfoods

The açaí berry is native to the Amazon rainforest and in particular to Brazil. It is a berry that has high quantities of phytochemicals, plant compounds that are believed to protect us from a variety of ills, from heart disease to cancer. Through heavy marketing of the berry as a sort of miracle cure, a market for this fruit was created and grew rapidly, reaching a high in 2009.

The açaí berry is what is often called a superfood, a category of foods that are nutrient dense, thus rich in vitamins, minerals and other nutrients while having few calories. So-called superfoods that are new to the U.S. market appear to follow a somewhat predictable cycle. They become the hyped new health food. Demand for them rises sharply and they ride this tide. Then they begin a decline as their high prices are balanced against the consumer’s experience with them and the promise of a new, heavily marketed superfood. Worth noting is the fact that blueberries are very nearly as rich in polyphenols as are açaí berries yet they are priced at a fraction of the price of açaí berries.

Today’s market size is an estimate of the total value of açaí-laced products sold in the United States in 2012.

Geographic reference: United States
Year: 2012
Market size: $200 million
Source: Tom Philpott, “Farm to Fable,” Mother Jones, May/June 2013, page 68
Posted on April 23, 2013

Canned Fishery Products

Fishery products are canned for both human and animal consumption. In the United States, in 2010, 68.8% of all canned fishery products by weight were produced for human consumption and 31.3% for animal food and bait. In terms of value, the breakdown was 84.7% for human consumption and 15.3% for animal consumption.

Geographic reference: United States
Year: 2010
Market size: 954.14 million pounds valued at $1.411 billion
Source: “Fisheries of the United States–2010,” August 2011, page 46, available online from the National Marine Fisheries Service website, here.
Original source: National Oceanic and Atmospheric Administration (NOAA), Office of Science and Technology, National Marine Fisheries Service, USDA
Posted on March 6, 2013

Fish Oil

Fish oil is a commodity derived from the tissues of oily fish. This oil contains high levels of the Omega-3 fatty acids eicosapentaenoic acid (EPA) and docosahexaenoic acid (DHA) which is part of the reason that offerings of fish oil as a dietary supplement have seen growing popularity. Today’s market size is the volume and value, at a wholesale level, of fish oil production in the United States in 2010.

Geographic reference: United States
Year: 2010
Market size: 136.4 million pounds or 17.6 million gallons valued at $30.1 million
Source: “Fisheries of the United States–2010,” August 2011, page 42, available online from the National Marine Fisheries Service website, here.
Original source: National Oceanic and Atmospheric Administration (NOAA), Office of Science and Technology, National Marine Fisheries Service USDA
Posted on December 3, 2012

Cranberries

Today we look at cranberries, one of the ingredients of a traditional Thanksgiving Day meal in the United States. The market we present here is the size, measured in barrels, of U.S. cranberry production annually over four decades.

We hope that as the Thanksgiving Holiday weekend proceeds in the United States, that all of our visitors have many reasons to give thanks this year.

Geographic reference: United States
Year: 1980, 1990, 2000, 2010
Market size: 2.70, 3.44, 5.84, and 6.81 million barrels respectively
Source: “Cranberries—2012 Cranberry Production Down Slightly,” August 14, 2012, and earlier reports on cranberry production, all produced and made available by the U.S. Department of Agriculture’s National Agricultural Statistics Services. The Annual reports on cranberry production are listed on the USDA’s website here.
Original source: U.S. Department of Agriculture
Posted on November 21, 2012

Tuna

Tuna fish, in the form of canned tuna, is a staple of the U.S. diet and is the largest of the canned fish markets by both weight and value. Today’s market size is the production in 2010 of canned tuna in the United States.

Geographic reference: United States
Year: 2010
Market size: 395.4 million pounds at an estimated wholesale value of $723.8 million dollars
Source: “Fisheries of the United States–2010,” August 2011, page 42, available online from the National Marine Fisheries Service website, here.
Original source: National Oceanic and Atmospheric Administration (NOAA), Office of Science and Technology, National Marine Fisheries Service, USDA
Posted on November 6, 2012

Canned Clams

U.S. canned clam production in 2010 is the market size today. The value per pound for canned clams in 2010 was just shy of one dollar ($0.89). As compared with the highest volume canned fish product, namely tuna, canned clams were 27.7% of tuna by weight and 13.5% by value.

Geographic reference: United States
Year: 2010
Market size: 109.3 million pounds at a value of $97.2 million
Source: “Fisheries of the United States–2010,” August 2011, page 42, available online from the National Marine Fisheries Service website, here.
Original source: National Oceanic and Atmospheric Administration (NOAA), Office of Science and Technology, National Marine Fisheries Service, USDA
Posted on October 25, 2012

Pickles

Gerkins

Today’s market size is the size of the market of U.S. produced pickles and pickled products in 2005 and again in 2010. The values listed are for product shipments from the pickles and other pickled products industry (NAICS 311421P) as reported on by the U.S. Census Bureau in its reports on the manufacturing industry.

Geographic reference: United States
Year: 2005 and 2010
Market size: $1.31 and $1.46 billion respectively
Source: “Annual Survey of Manufactures: Value of Product Shipments: Value of Shipments for Product Classes,” the 2005 and 2010 editions, available online from the American Factfinder, for 2005, here, and for 2010, here.
Original source: U.S. Departemnt of Commerce, Bureau of the Census
Posted on October 2, 2012