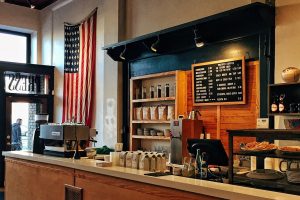
Coffee Cafes

Coffee cafeAccording to the National Coffee Association’s 2017 National Coffee Drinking Trends report, 62% of Americans drink coffee on a daily basis and 46% of coffee consumed is done so away from home. Although the recent popularity of coffee cafes may be traced back to the 1990s when Starbucks expanded across the country, TV show friends were seen hanging out at Central Perk coffeehouse, and laptops and wi-fi allowed workers to work from anywhere, coffee cafes are nothing new. The first public place to serve coffee dates back to 1475 in Constantinople, Turkey (now Istanbul).

Today’s market size shows the total sales of coffee cafe chains in the United States in 2016. The top three coffee cafe chains, in terms of sales, are Starbucks (estimated $14.7 billion, accounting for nearly 60% of the total sales at coffee cafe chains in the U.S.), Dunkin’ Donuts ($8.2 billion), and Tim Hortons (estimated $760 million).

Geographic reference: United States
Year: 2016
Market size: $24.8 billion (a 9.7% increase from 2015)
Sources: “Coffee Cafe,” Restaurant Business, June 2017, page 55 available online here; Paajanen, Sean, “The Evolution of the Coffee House,” The Spruce, November 27, 2016 available online here; Mock, Brentin, “What Made Coffeehouse Culture Go Boom?” CityLab, January 23, 2017 available online here; Auffermann, Kyra, “From Brew Boomers to the Gourmet Generation: National Coffee Drinking Trends 2017,” The First Pull, National Coffee Association, March 28, 2017 available online here; DeRupo, Joe, “Daily Coffee Consumption Up Sharply,” National Coffee Association News Release, March 25, 2017 available online here.
Original source: Technomic’s Top 500 Chain Restaurant Report
Image source: Free-Photos, “coffee-shop-american-flag-america-1081713,” Pixabay, January 7, 2016 available online here.

Specialty Limited-Service Restaurants

Krispy Kreme restaurantA limited-service restaurant is one in which customers choose, order and pay for their food ahead of time. The food can be eaten in the restaurant, taken out, or delivered. Specialty limited-service restaurants specialize in one type of meal or menu item. Today’s market size shows the total sales at these types of restaurants. The top three specialty limited-service restaurants in terms of sales in 2016 were Krispy Kreme (estimated $758 million), Dickey’s Barbeque Pit (estimated $557.6 million), and Auntie Annie’s ($547.9 million).

Geographic reference: United States
Year: 2016
Market size: $6.9 billion
Source: “Specialty LSR,” Restaurant Business, June 2017, page 52 available online here.
Original source: Technomic’s Top 500 Chain Restaurant Report
Image source: GoToVan, “Krispy Kreme in Delta (14865312212).jpg,” Wikimedia Commons, August 9, 2014, CC-BY-2.0 license available online here. Use of image does not constitute endorsement of brand.

Office Coffee Service

The market for office coffee service—this service, often abbreviated OCS, provides companies with the hardware and consumables needed to supply their employees and guests with hot beverages, usually coffee—declined during the recession of 2007-2009 but began to grow again in 2011. This turnaround occurred more quickly than did the rebound for the larger vending machine contractors industry generally. Credit is given by the industry to its ability to be flexible and to alter its offerings. In particular, the rising popularity of single-cup systems has helped the industry to weather economic cycles throughout the first decade of the 2000s.

Today’s market size is the value of the office coffee service market in 2011, a figure that was forecast to rise by 3.5% in both of the following two years.

Geographic reference: United States
Year: 2011
Market size: $4 billion
Source: “Report: Office Coffee Sales To Increase 3.5 Percent Annually in 2012 and 2013,” February 21, 2012, Vending Marketwatch, available online here.
Original source: Packaged Facts
Posted on January 10, 2013

Better Burger Restaurants

The better burger restaurant market is defined as establishments that make burgers to order with fresh ingredients, in particular, fresh meat. Examples of the sorts of restaurants that are counted as better burger restaurants include Red Robin Gourmet Burgers, Five Guys Burgers and Fries, and Bagger Dave’s.

Although the market for better burger restaurants is still minuscule compared to the $200 billion fast-food and fast-casual burger restaurant market, sales growth exceeded growth in the fast-food and fast-casual burger restaurant market in 2010. Sales growth for better burger restaurants was 21% compared to a 3.2% growth rate for fast-food and fast-casual burger restaurants. Better burgers are often made with fresh Angus beef, better-quality buns, premium cheeses, and homemade condiments. Some better burger restaurants also offer turkey burgers and veggie burgers. Data represent restaurant sales in 2011.

Geographic reference: United States
Year: 2011
Market Size: $2.2 billion
Source: Davis, Scott, “Building a Better Burger: Mid-Michigan Opens Wide for ‘Better Burger’ Market,” Lansing State Journal, August 12, 2012, page 1E
Original Source: Technomic
Posted on August 14, 2012

Restaurant Market

In the United States the trend towards eating out, as opposed to making meals at home, has been on a steady upwards trajectory for more than a century. The arrival of the car and the interstate highway system made us more mobile and fast food restaurants increased greatly our opportunities to “grab a bite on the road.” In 1950 American’s spent approximately 24% of their food budget on food eaten away from home. In 2010 that percentage had doubled, to 48%.

Today’s market size is the estimated sales revenue at full-service restaurants in the United States in 2010. This does not include fast food restaurants, catered affairs or even specialty food services like the cafeterias set up in office buildings or other institutional settings, nor such things as food carts that sell from the street or park or parking lot. Full-service restaurants are those that provide a meal to customers who come to sit down and be served a meal.

Geographic reference: United States
Year: 2009
Market size: $195.35 billion
Source: “Estimated Annual Sales of U.S. Retail and Food Services Firms by Kind of Business: 1992 Through 2009,” Annual Retail Trade Survey, March 31, 2011, a PDF version of the table is available here.
Original source: U.S. Census Bureau [a wonderful and important part of the U.S. Department of Commerce that, due to funding cutbacks, is in the process of eliminating some of their valuable services. We are sorry to see them go and we sincerely hope that the cutbacks will not in any way reach the core data collection work done in the Economic Census program itself or the eqaully crucial sector-based annual surveys that so carefully track economic activity by sector—Annual Survey of Manufactures; Service Annual Survey; Annual Retail Trade Survey; Annual Wholesale Trade Survey, etc…].
Posted on November 9, 2011

The Business of Weddings

Today’s market size is an estimate of the size of the entire wedding industry in the United States—we take some license in using the word “industry” here. The things included in measuring the size of the wedding industry are many, from planning, apparel and jewelry through the ceremony, flowers, food, reception and honeymoon.

Geographic reference: United States
Year: 2010
Market size: $47.2 billion
Source: Toon Van Beeck and George Van Horn, “Wedding Bells are Ringing,” The RMA Journal, December 2010-January 2011, page 22-27, available online here.
Original source: IBISWorld
Posted on October 5, 2011

Cookies and Bagels

Bagel shops and cookie shops have both seen a decline in numbers during the first decade of this century while the number of coffee shops has more than doubled. An interesting shift seems to be taking place.

Geographic reference: United States
Year: 2002 and 2007
Market size: Number of Bagel Shops, 3,203 and 3,072 respectively
Market size: Number of Cookie Shops, 1,025 and 951 respectively
Source: “2007 Economic Census: Sector 72: Accommodation and Food Services,” June 22, 2010, available online here.
Original source: U.S. Bureau of the Census

Pizza Market

Data represent the estimated number of pizzas sold per year in the United States. Seventeen percent of restaurants in the United States are pizzerias.

Geographic reference: United States
Year: 2009
Market size: 3 billion pizzas
Source: “Pizza Facts,” Guido’s Premium Pizza, September 27, 2010 available online here.
Original Source: Blumenfield and Associates; Food Industry News.

Vending Machine Market

Vending machines in manufacturing facilities represent 33.5% of all vending machines in place. Office buildings account for 22.5% of vending machine locations while schools and colleges account for 11.5%. The remaining vending machines are in locations as diverse as shopping malls, hotels, airports, gas stations, hospitals and other service outlets and public institutions.

Geographic reference: United States
Year: 2007 and 2008
Market size: $23.2 billion and $22.8 billion respectively
Source: Automatic Merchandiser, August 2009, page 28