Fireworks

fireworks and American flag
July 4 is Independence Day in the United States. Because July 4th is a Sunday in 2021, the Federal holiday is celebrated on July 5th.
Geographic reference: United States
Year: 2000, 2009, 2019
Market size (display): 50.6 million pounds, 31.7 million pounds, and 24.1 million pounds, respectively
Market size (consumer): 102 million pounds, 182.2 million pounds, and 248.9 million pounds, respectively

For many, Independence Day celebrations aren’t complete without fireworks, either large professional displays or smaller pyrotechnics in one’s yard. Today’s market size shows the amount of fireworks consumed in 2000, 2009, and 2019 both by professional displays and by consumers. Even before many fireworks shows were canceled in 2020 due to the pandemic, the amount of fireworks used in professional displays has been going down, a drop of more than 52% from 2000 to 2019. Meanwhile, the cost of display fireworks went from $203 million in 2000 to $375 million in 2019, a nearly 85% jump. With the added costs of not just the fireworks, but the cost of hiring professional pyrotechnic experts, insurance, and police, fire, and paramedic presence, many cities and towns have found it cost-prohibitive to continue their annual fireworks displays or have scaled them back. In some cases, cities and towns have looked to sponsors to fund all or most of their events, with mixed success. In certain parts of the country prone to drought conditions, especially in the West, fireworks displays and consumer fireworks have been banned altogether. Consumption of consumer fireworks followed an opposite trend over this time period. From 2000 to 2019, sales of consumer fireworks jumped 144% (pound basis), and revenue jumped 145%. 

In 2019, the United States imported $319.3 million worth of fireworks. Nearly 96%, or $304.5 million, came from China. Other countries in the top 5 include Spain ($4.8 million), Hong Kong ($4.6 million), Thailand ($1.7 million), and Germany ($1.4 million). Which states import the most? Missouri topped the list both by value ($51.1 million) and per capita ($8.34). Following Missouri by value were Mississippi ($42.3 million), Ohio ($30.4 million), Alabama ($28.4 million), and South Carolina ($18.9 million). Per capita, Alabama ($5.80), Kansas ($5.53), Wyoming ($4.07), and South Carolina ($3.72) round out the top 5.

The United States also exports fireworks, but the export value is only a fraction of imports: $5.6 million in 2019. The top states for exports include New Jersey, Florida, Montana, New York, and Alabama. Only New Jersey and Florida exported a total of more than $1 million: $1.9 million and $1.7 million, respectively. According to Thomasnet.com, the leading fireworks manufacturers in the United States based on estimated annual sales include TNT Fireworks, Young Explosives, International Fireworks Co., Fireworks by Grucci Inc., Santore & Sons Inc., Dominion Fireworks Inc., American Fireworks, Fireworks Supermarkets, and Rozzi’s Famous Fireworks Inc. Leading novelty fireworks suppliers include Zambelli Fireworks Manufacturing Co., Wholesale Fireworks, Atomic Fireworks Wholesale, Galaxy Fireworks Inc., and Pyro Direct. Both Santore & Sons and Zambelli Fireworks have been in business since the 1890s.

Sources: “U.S. Fireworks Consumption Figures 2000-2019,” American Pyrotechnics Association available online here; “U.S. Fireworks Industry Revenue Figures Breakdown by Industry Segment 1999-2019,” American Pyrotechnics Association available online here; Sterling Price, “Fourth of July: Who Uses the Most Fireworks in the US?” ValuePenguin, June 26, 2020 available online here; Christian Cavallo, “The Top Fireworks Manufacturers and Suppliers in the USA,” Thomas Publishing Company available online here; “Economy Affecting Fireworks Displays?” abc7ny, July 3, 2008 available online here; Brad Tuttle, “Why Your Town Isn’t Having a July 4 Fireworks Show This Year,” Money, June 29, 2016 available online here; Curt Yeomans, “Fireworks Shows Carry Big Costs for Local Cities,” Gwinnett Daily Post, June 30, 2019 available online here.
Image source: Free-Photos, “sparkler-usa-american-flag-united-839806,” PIxabay, July 12, 2015 available online here.

Vinyl Records

vinyl records
While in-store celebrations of Record Store Day have been postponed due to the coronavirus pandemic, RSD Drops, special titles coming to participating indie record stores, will take place on June 12 and July 17 of 2021.
Geographic reference: United States
Year: 2006, 2013, and 2020
Market size: $15.7 million, $210.7 million, and $619.6 million, respectively

For much of the 20th century, vinyl records dominated the recorded music industry. The first commercially-available long-playing vinyl record was introduced by RCA Victor in 1930. Even when other forms of recorded music were available in the 1970s, vinyl still held a majority of the market. In 1975, LP/EP sales accounted for 62.2% of sales, with vinyl singles garnering another 8.9% of the market. In the 1980s, as cassette tapes became more popular and compact discs (CDs) were introduced, sales of vinyl records plummeted from 71.1% of sales in 1980 to 8.8% of sales in 1989. 

Cassette tapes, introduced in the 1960s, offered music aficionados portability and durability. Consumers could record their favorite music from the radio to create on-the-go playlists and custom mixtapes. In 1983, the first CD players were sold in the United States. Initially few albums were released on the format and players retailed for $1,000; however, by 1988 CDs were so popular they outsold vinyl albums. CDs would go on to outsell cassette tapes in 1991.

Vinyl records did not completely disappear. In 1993, vinyl record sales totaled 300,000 units, or 1.6% of total recorded music sales volume and 0.1% of revenue. For much of the 1990s and early-to-mid 2000s, vinyl sales hovered around 1 million units, with peak sales of 1.5 million units sold in 2000. By 2005, CD sales in two major retail outlets were eclipsed by iTunes downloads as consumers found it more convenient and accessible to download music to their very small and portable iPods, some versions of which could store 2,000 or more songs. As popular as digital downloads were, streaming service revenue outpaced its sales by 2015. By 2018 many major retailers such as Best Buy and Target were discontinuing sales of CDs, but CDs still maintained a presence in 2020, selling 31.6 million units.

Meanwhile starting in 2006, vinyl record sales were increasing in popularity, especially among Millennials. Sales soared from 900,000 units in 2006 to 22.9 million units in 2020. Had it not been for a shortage of vinyl in 2020, sales may have gone higher. By 2020, vinyl record sales reached 5.1% of the $12.2 billion recorded music market (6.4% by volume), up from 0.1% in both revenue and volume in 2006.

What were the most popular vinyl LPs of the last decade? Abbey Road by the Beatles was number one, with 558,000 units sold between 2010 and 2019. Others in the top 8 include Dark Side of the Moon by Pink Floyd (376,000 units), Guardians of the Galaxy soundtrack (367,000), Legend by Bob Marley and the Wailers (364,000), Back to Black by Amy Winehouse (351,000), Thriller by Michael Jackson (334,000), Sgt. Pepper’s Lonely Hearts Club Band by the Beatles (313,000), and Rumours by Fleetwood Mac (304,000). For the first half of 2020, the top selling vinyl album was When We All Fall Asleep, Where Do We Go? by Billie Eilish.

Note: All sales figures are for new vinyl records.

Sources: “U.S. Sales Database,” The Recording Industry Association of America, 2021 available online here; Dillon Wallace, “When Did CDs Take a Front Seat to the Cassette Tape,” Aperture available online here; Aldo Svaldi, “Victrola Has Moved HQ to Denver,” Denver Post, March 18, 2021, pp. A9 and A11; “LP/Vinyl Album Sales in the United States from 1993 to 2019,” Statista, January 8, 2021 available online here; Joshua P. Friedlander, “Year-End 2020 RIAA Revenue Statistics,” February 2021 available online here; The Vintage Record, “The History of Vinyl,” American History Now, January 27, 2014 available online here; DJ Rob, “The Skinny (Or Maybe the Fat) on Vinyl in 2020 — and the Ten Best Selling Vinyl Records of 2020 So Far…” DJRobblog.com, July 11, 2020 available online here; Paul Riismandel, “More New CDs Than Vinyl Records Were Sold in 2020, Yet Again,” Radio Survivor, March 4, 2021 available online here; Felix Richter, “Classics Dominate LP Sales in the U.S.,” Statista, August 27, 2020 available online here; Felix Richter, “The Vinyl Comeback Continues,” Statista, January 15, 2021 available online here; Felix Richter, “From Tape Deck to Tidal: 30 Years of US Music Sales,” The Wire, March 7, 2021 available online here.
Image source: AliceKeyStudio, “turntable-vinyl-sound-music-1208177,” Pixabay, February 19, 2016 available online here.

Video on Demand

video on demand streaming
Video on demand is a method of media distribution in which viewers can access a provider’s library of video content with or without a television set and without the constraints of a static broadcasting schedule as is the case with over-the-air programming. Video on demand can be offered through internet protocol television (IPTV) services or through over-the-top (OTT) media services. IPTV uses a dedicated, private network provided by an internet service provider to stream live television, pay-per-view, and video on demand content over the internet through a set-top box or “stick” device connected to a customer’s television or directly through an app on a smart TV that has wi-fi capabilities. IPTV content can also be viewed using apps on tablets and smartphones and on computers through a web browser or through video applications that can play M3U8 files. As of April 2019, there were an estimated 100 million IPTV subscribers worldwide.

While there are many legal IPTV providers such as Sling TV, Xfinity Flex, DirecTV Now, AT&T U-verse and Zattoo, to name a few, there are also many companies that provide content they are not licensed to sell. According to a 2017 Sandvine Intelligent Broadband Networks study, 6.5% of North American households have accessed a pirated IPTV service. Pirated IPTV services were valued at $840 million per year while traditional content providers lost $4.2 billion per year due to copyright infringement. In recent years, content providers have filed lawsuits against IPTV providers that transmit unauthorized content. In 2019, Set TV NOW, with more than 180,000 subscribers, was the first major IPTV provider to shut down. The judge ordered the company to pay DISH Network Corp. more than $90 million in damages. In November 2019, police raids in Spain, Italy, the Netherlands, France, and Bulgaria shut down Xstream-codes.com, a company that provided the software that ran many IPTV systems. Its 5,000 clients, IPTV providers, served more than 50 million customers around the world. In 2020, more lawsuits against these types of companies are expected in the United States and around the world. Lawsuits against companies that make the services possible such as website hosting companies, file hosting companies, and companies that process the payments are also expected.

OTT services use the open internet to stream their video on demand content. A customer’s internet service provider treats data packets for streamed content the same as data packets for any other content sent over the internet. As a result, the quality of the viewing experience depends on the speed and quality of the customer’s internet connection. Customers need either a set-top box, “stick” device, multipurpose device like a game console that can stream video content, or a wi-fi enabled smart TV to view content on their television sets. OTT content can also be viewed on computers, tablets, and smartphones.

There are three types of OTT services: advertising-based (AVOD), transaction-based (TVOD), and subscription-based (SVOD). Advertising-based services are free to use, but customers must watch commercials like they do when they watch over-the-air, cable or satellite TV. YouTube and DailyMotion are examples of AVOD services. Transaction-based services allow users to sign up for the service for free and then the amount they pay is dependent on the content they watch. iTunes is an example of a TVOD service. Subscription-based video on demand services may be the best-known type of OTT. A user pays a monthly or yearly fee to stream an unlimited amount of video content. Netflix and Hulu are two examples of subscription-based OTT services.

Today’s market size shows the total global revenues for video on demand services for 2019 and projected for 2024. OTT services have the highest market share with subscription-based service revenue expected to grow at the highest compound annual growth rate (CAGR) over this time period. Overall, the global video on demand market is expected to grow at a CAGR of 17.5%. According to analysts, growth in this industry will be due to increasing broadband internet access globally, including access to 4G and 5G technologies, and the increasing popularity of smartphones. Services that offer a large variety of content in different genres and languages will also contribute to growth in this industry. North America is expected to account for 40% of the revenue between 2019 and 2024, with the Asia-Pacific region claiming 30%, Europe 20%, Latin America 5% and the Middle East and Africa 5%. Leading companies include Netflix, Amazon, Google, YouTube, Apple, Roku, Vudu, Hulu, Huawei, and Fujitsu among others. In the Asia-Pacific region the following companies are expected to capture most of the market share: YouTube, iQiyi, Tencent Video, Youku, ByteDance, Netflix, Amazon, Hotstar, and Hulu Japan.

Geographic reference: World
Year: 2019 and 2024
Market size: $38.4 billion and $87.1 billion, respectively
Sources: The Video on Demand (VoD) Market Size is Expected to Grow from USD 38.9 Billion in 2019 to USD 87.1 Billion by 2024, at a Compound Annual Growth Rate (CAGR) of 17.5%,” CISION PRNewswire Press Release, January 28, 2020 available online here; “2017 Global Internet Phenomena,” Sandvine Intelligent Broadband Networks, October 27, 2017 available online here; “What is IPTV? Everything Cord Cutters Need to Know,” AntennaJunkies.com available online here; Luke Bouma, “IPTV Came Under Fire in 2019 & in 2020 It Maybe All Out War,” Cord Cutters News, January 1, 2020 available online here; Luke Bouma, “Dish Officially Announces Legal Action Against Two IPTV Services,” Cord Cutters News, January 19, 2018 available online here; Ali Ahmed Awan, “Understanding the Terms SVOD, AVOD, TVOD and the Difference Between VOD and OTT,” ClipBucket, March 7, 2019 available online here; Dan Price, “The Best Legal IPTV Service Providers in 2019,” MakeUseOf, December 4, 2019 available online here;
Image source: Glenn Carstens-Peters, Unsplash, June 10, 2019 available online here.

Summer Enrichment Programs

summer enrichment programs, summer campWhat did you do on your summer vacation? The ubiquitous question that’s asked of children and young adults as they return to classes in the fall. The responses may differ greatly depending upon what country the student lives in or how wealthy their parents are. Many students may say they attended summer camp. When parents and grandparents in the United States think of their experiences at summer camp they may remember rustic cabins, swimming, canoeing, arts and crafts, and sitting around a campfire in the evenings. However, increasingly in the U.S. and around the world summer camps, or summer enrichment programs as they are sometimes called, cater to niche interests or focus on in-demand workforce skills. According to the American Camp Association, the percentage of camps offering science, technology, engineering, and math programs grew from less than 25% in 2014 to more than 33% in 2017. Demand for such camps is increasing as more affluent parents want to give their children not only an enjoyable experience but also a competitive advantage in school and in the workforce, even if many of these students are still in elementary school. As summer enrichment programs become more specialized, exclusive, and expensive, fewer students from lower- and middle-income families will be able to take advantage of these opportunities.

In China, many wealthy parents send their children abroad in the summer to take advantage of study tours in the hopes of broadening their children’s view of the world and preparing them to attend college in other countries. Today’s market size shows the estimated amount Chinese parents will spend on study tours abroad in 2018. An estimated 1 million Chinese students will take these tours this year. According to Chu Zhaohui, a researcher at the National Institute of Education Sciences,1 the United States, the United Kingdom, and Australia are the top three destinations for study abroad tours.

1 The National Institute of Education Sciences is a research division of the Ministry of Education in the People’s Republic of China.

Geographic reference: China
Year: 2018
Market size: $4.5 billion
Sources: “Mutually Assured Distraction,” The Economist, August 11, 2018, page 47; Ma Xuejing, “Study Tours Abroad More Hype Than Substance,” China Daily, June 22, 2018 available online here.
Original source: Ctrip, a Chinese travel agency
Image source: davidraynisley, “paddle-summer-camp-camp-summer-3414020,” Pixabay, May 2018 available online here.

Amusement and Theme Parks

Number of amusement parksWithin the economic sector Arts, Entertainment and Recreation is the Amusement and Theme Park Industry. According to the U.S. Census Bureau “[t]his industry comprises establishments … primarily engaged in operating a variety of attractions, such as mechanical rides, water rides, games, shows, theme exhibits, refreshment stands, and picnic grounds. These establishments may lease space to others on a concession basis.” As the graph above shows (click graph to enlarge), the number of amusement and theme parks fluctuated from 1998 to 2016. Some years there were fewer than the previous year; some years there were more. However, overall the number trended downward. There were 37.7% fewer amusement and theme parks in 2016 than there were in 1998. Employment in this industry also fluctuated during this time period, but in this case, the trend was upward. There were 37.1% more people employed in this industry in 2016 than in 1998: 157,336 and 114,786 respectively.

Fewer amusement and theme parks employing more people would indicate that overall these parks were larger in 2016 than in 1998. In 1998, the top 3 states with the most amusement and theme parks were Florida (87), Texas (82) and California (81). By 2016, Texas had the most parks with 74, followed by Florida and California with 59 and 54 respectively. However, of these three states, Texas employed the fewest workers in this industry, 8,965; Florida the most, 58,187. In 1998, Florida also employed the most workers in this industry, 38,844, followed by California (31,330) and Texas (12,352). How much did employees earn? In 1998, the average yearly salary for an amusement and theme park worker was $16,378. In 2016, $26,427, a 61.4% increase. Adjusting for inflation, the increase was not as large, 11.3%, but still outpaced inflation.

Today’s market size shows the revenues amusement and theme parks in the United States earned in 1998 and 2016. Revenues increased 131.2% during this time period, or slightly more than 59% when adjusting for inflation.

Geographic reference: United States
Year: 1998 and 2016
Market size: $7.4 billion and $17.1 billion respectively
Sources: 2005, 2007, 2008, 2009, 2010, 2012, and 2016 Service Annual Survey, various publication dates available online here; County Business Patterns, various publication dates available online here; “Table B-3: Quantity and price indexes for gross domestic product, and percent changes, 1967-2017,” Economic Report of the President, February 2018 available online here; “2017 NAICS Definition: 713110 Amusement and Theme Parks,” North American Industry Classification System available online here.
Image source: Created in-house using data from County Business Patterns. Click graph to enlarge.

Wireless Speakers Enabled by Personal Assistants

Amazon Echo and Google Home are two versions of wireless speakers that do more than play music. They are also voice-activated personal assistants. Some of their capabilities include adjusting a smart thermostat, turning lights on or off, arranging a ride through Uber, and delivering the news, sports, and weather. As prices have come down for these devices, in some cases retailing for less than $50, popularity has risen.

Today’s market size is the value of the market for voice-activated wireless speakers/personal assistants in 2015 and the projected value of the market in 2020 according to Gartner. The value of the market is expected to increase more than 5-fold in this 5-year period.

Geographic reference: World
Year: 2015 and projection for 2020
Market size: $360 million and a projected $2.1 billion respectively
Source: Ed Baig, “Google Home Plays Catch-Up to Echo, with Promise,” USA Today for the Lansing State Journal, November 6, 2016, page 6B
Original source: Gartner.

Information Sector

Info. SectorToday we’re looking at one sector of the U.S. economy, the Information Sector. This sector includes industries such as publishing, movie making, telecommunications, broadcasting, data processing, web hosting and all sorts of Internet activities associated with the dissemination of information. The sector is identified in the North American Industrial Coding System (NAICS) as sector 51 and includes the activities of 78 industries.

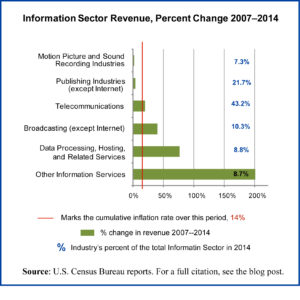
Total revenue for this sector grew by 26% from 2007 to 2014, making it one of the better-performing sectors within the larger Service Sector. Yet a closer look at the main groups in the Information Sector shows that their paths vary greatly over this period. The broadcasting industries and those related to the Internet saw real growth while the others saw little if any growth, considering that the cumulative inflation rate over this period was 14%.

The chart above shows the growth each of the industrial sectors within the Information Sector has had over the period at which we’re looking and includes a red line showing the cumulative rate of inflation over the period. Real growth only happened in the industries whose growth rate exceeded the cumulative rate of inflation.

Geographic reference: United States
Year: 2007 and 2014
Market size: $1.08 and $1.37 trillion respectively
Source: “Table 1: Estimated Revenue for Employer and Nonemployer Firms: 2007 through 2014,” 2014 Services Annual Survey, U.S. Census Bureau, January 28, 2016, available online here.
Original source: U.S. Department of Commerce, Bureau of the Census
Posted on May 24, 2016

Movie Tickets

The Motion Picture Association of America tracks movie box office receipts very closely. The resulting statistics are available rather quickly for North America but they take longer to come in from other parts of the world. Revenues from theatrical releases of a movie are only the beginning of the revenue generated by a film. Nonetheless, they are important to the movie industry and they are growing most strongly outside the industrialized world, where the number of theaters being opened annually is rising.

Today’s market size is the global box office revenue in 2008 and 2012, with a geographical breakdown to show what percentage of the total revenue was generated in the U.S. and Canada.

Geographic reference: World
Year: 2008 and 2012
Market size: $27.7 billion (U.S./Canada 53.3%) and $34.7 billion (U.S./Canada 45.2%)
Source: “Global Box Office—All Firms (US$ Billions),” Theatrical Market Statistics 2012, MPAA, Summer 2013, page 4, available online here.
Original source: Motion Picture Association of America, Inc. and Rentrak Corporation
Posted on April 2, 2014

Electronic Games

The world of games, electronic games, is changing quickly as mobile devices become an ever more important platform on which they’re played. As a result, one may find estimates of sizes for this market that vary greatly, all depending on how a particular source defines the market. What was once primarily a software business—the making of electronic games to be sold, loaded onto a computer and then played—has become something much broader. Access to the Internet and higher speed connections globally have also fueled the growth in this industry.

Today’s market size is an estimate of total revenues—including all platforms, PCs, smartphones, TV and consoles, tablets, and massively multiplayer online (MMO) games—of the global electronic games market in 2012 and a forecast for revenues in 2016.

Geographic reference: World
Year: 2012 and forecast for 2016
Market size: $66.3 billion and $86.1 billion
Source: Dean Takahashi, “Mobile growth will fuel global game market that hits $86.1B by 2016,” VB Gamebeats, June 6, 2013, available online here.
Original source: Newzoo
Posted on March 31, 2014

Super Bowl TV Ads

SuperBowlAds

The Super Bowl is one of the big, annual TV events in the United States and as such it draws a large number of views. As a result, those wishing to reach a broad audience and having lots of money to spend, like to advertise during the Super Bowl. In fact, for many viewers, the advertisements themselves have become part of the attraction of the event.

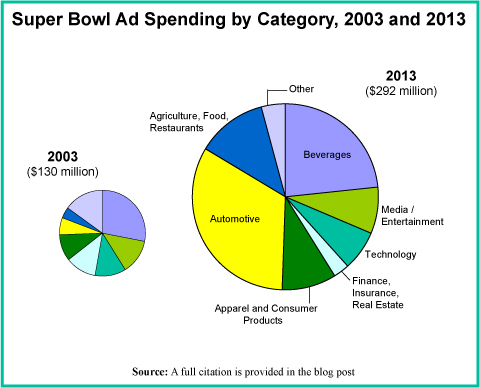
The pie graph we present here shows ad spending by industry category in 2003 and 2013. Clearly, the auto industry has decided that the Super Bowl is a great way to grab attention for new cars and trucks. In 2013 that industry accounted for 33% of Super Bowl ad spending, up from 7% in 2003.

Today’s market size is the total spent on TV advertisements during the Super Bowl in 2003 and in 2013. The source we link to below provides a very interesting, interactive graphic with details on each Super Bowl from 2000 through 2013 as well as links to videos of memorable advertisement broadcasts in each year.

Geographic reference: United States
Year: 2003 and 2013
Market size: $130 and $292 million respectively
Source: Andrew Garcia Phillips and Willa Plank, “Super Bowl Spending Driven by Automotive Ads,” Wall Street Journal, available online here.
Original source: Kantar Media
Posted on February 5, 2014

Youth Sports Tourism

An estimated 35 million children in the United States between the ages of 5 and 18 play organized sports every year. Of those, 21 million play non-school youth sports, which include baseball, soccer, lacrosse, rowing, hockey, volleyball, and gymnastics. These non-school groups are organized through local programs, such as Little League, or through sports clubs.

Unlike school-sponsored sports, in which teams usually travel by bus from one local school to another for games and tournaments, non-school sports games and tournaments may be held either across town or across the country. Parents are expected to spend the time and money to take their children to these events. Because of the money families spend while at these far away locations, more cities are planning to build sports complexes to attract youth sports tournaments.

Today’s market size is an estimate of the total spent in 2013 by families in the United States on travel for youth sports, including hotels, restaurants, and shopping. This category of tourism—Youth Sports Tourism—didn’t even exist a few years ago but is now one that is keenly tracked by industry observers and chambers of commerce.

Geographic reference: United States
Year: 2013
Market size: $7 billion
Source: Mark Koba, “Spending Big on Kids’ Sports? You’re Not Alone,” CNBC.com, January 13, 2014, available online here.
Original source: Minnesota Amateur Sports Commission
Posted on January 16, 2014

Haunted Houses

Pumpkins-2013-4

Halloween is no longer a one day affair and haunted houses aren’t just for kids anymore. Many haunted houses are Hollywood-style productions with animatronics, realistic special effects, and actors in professional makeup. Haunted houses of the past were often run by neighborhood organizations as a way to do a bit of fundraising. Today, many are straightforward profit making operations.

Some operators of haunted houses combine them with rock concerts, mud runs, and paintball battles. Others combine multiple sets with corn mazes and hayrides. The haunted house experience has become an evening’s entertainment for many. More than 31 million people are expected to visit haunted houses in 2013. Worldwide there are around 2,500 haunted house attractions, the vast majority in the United States.

Today’s market size is the estimated total sales generated by haunted houses in 2013 (dare we say, by the haunted house industry?). Now that is scary….

Happy Halloween

Geographic reference: World
Year: 2013
Market size: $300 million… still a fraction of the estimated $7 billion that will be spent on Halloween related items and activities in the United States this year!
Source: Martha C. White, “It’s Aliiiive! Haunted-House Industry Scares Up Big Money,” NBC News, October 6, 2013, available online here.
Original source: National Retail Federation
Posted on October 31, 2013

Expenditures on Reading Materials

The U.S. Bureau of Labor Statistics (BLS) carries out an annual survey of millions of households to track what they spend money on, by category. The resulting data has been collected over decades and seeing the trends that these data expose over time is very interesting.

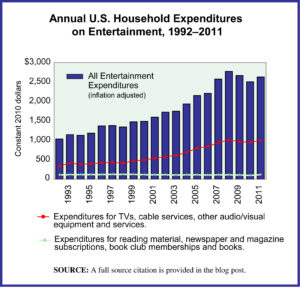
The graph presented here is made with BLS data from this survey series. It shows inflation-adjusted household expenditures on all categories of entertainment, as well as two subsets of expenditures, (1) those for TVs, audio/video equipment and services, such as cable subscriptions and (2) expenditures for reading material. The full category of entertainment expenditures is broad and includes things such as:

—Fees to attend concerts, sporting events, movies, and sporting clubs/fraternal organizations.
—TVs, radios and other audio/video equipment as well as subscriptions for cable, premium TV and the like.
—Pets, toys and hobbies, as well as all the services and equipment related to those.
—Bikes, athletic shoes, and equipment for camping, exercising, fishing, and all sports, as well as boats and docking fees, fireworks, pinball machines and video consoles.

Today’s market size is the average spent by U.S. households on reading material in 1994 and in 2011. The figures do not include expenditures for any textbooks or reading material purchased as part of a formal educational program. The transition to digital which is taking place in most areas of publishing is not well tracked by this BLS survey series. It is unclear from studying the survey results, for example, whether or not all online subscriptions to newspapers and magazines are consistently captured in the expenditure category “Reading.” Over time this will change as time allows data collection organizations, like the BLS, to adjust to the digital transition. Data collection organizations can only adjust as quickly as the industries they cover—in this case, the publishing industry—adjust to such dramatic changes.

Geographic reference: United States
Year: 1994 and 2011
Market size: $165 and $115 respectively. These figures translate to a national gross household spending on reading materials for each of those years of $16.86 billion and $14.06 billion respectively
Source: “Consumer Expenditure Survey,” Multiyear Tables: 1992-99 Multiyear Table, 2000-05 Multiyear Table, and 2006-11 Multiyear Table, all available on the Bureau of Labor Statistics website here.
Original source: U.S. Department of Labor, Bureau of Labor Statistics, Consumer Expenditure Surveys
Posted on May 9, 2013

Cable and Premium TV Market

Cable TV revenues

Economic data show that most industries in the United States saw declines of some sort during the recent recession and accompanying financial crisis of 2007—2009. One industry which appears to have weathered the downturn without noticeable declines is the pay television broadcasting industry. It is true that the growth they’ve seen may have been larger were it not for the economic downturn. Nonetheless, based on overall revenue, the industry’s growth trajectory has shown not a blip as can be seen in the chart.

Today’s market size post is based on industry revenues for cable services from basic and premium broadcasting as well as installation services and high-speed Internet access through cable lines.

Geographic reference: United States
Year: 2000 and 2010
Market size: $36.43 and 93.37 billion respectively
Source: “Table 1142. Cable and Premium TV—Summary: 1975 to 2010,” 2012 Statistical Abstract of the United States, December 2011, U.S. Census Bureau, page 717, available online here.
Original source: SNL Kagan, a division of SNL Financial L.C.
Posted on March 12, 2012

Cable Programming & Distribution

The U.S. economy is divided into large categories for the purpose of tracking economic activity and the “Information” sector of the economy is where such things as publishing, broadcasting and telecommunications reside. The rise of the digital age is having a major impact on the activities of this sector but for some, it is a very positive impact while for others the transition is more challenging. The cable business is one of the industries in this sector that is seeing robust growth in revenue and over the last five years has shown no sign of slowdown despite the recession and subsequent financial crisis of 2007-2009.

Today’s market size is the size of the U.S. cable program distribution and subscription programming industry in 2005 and 2010. These industries are designated with the following NAICS codes: 5152 (Cable and other subscription programming) and 5175 (Cable and other program distribution).

Geographic reference: United States
Year: 2005 and 2010
Market size: $117.1 and $176.5 billion respectively
Source: “Table 3.0.1 Information Sector (NAICS 51)—Estimated Revenue for Employer Firms: 2005 through 2010,” Service Annual Survey, February 2, 2012, available online here.
Posted on February 27, 2012

Great Lakes’ Fishing

After the Caspian Sea, the Great Lakes are the largest expanse of fresh water on Earth. The five lakes that lie on the border of the United States and Canada are, in order of size, Lake Superior, Lake Huron, Lake Michigan, Lake Erie and Lake Ontario.

Today’s market size is the size of the sports fishing industry on the Great Lakes.

Geographic reference: United States and Canada
Year: 2010
Market size: $7 billion
Source: Eric Sharp,”Dollars and Sense,” Detroit Free Press, Sunday, February 5, 2012, page 3C.
Posted on February 11, 2012

Spending on TV Ads During Sporting Championships

As we prepare to feast upon the spectacle that is the Super Bowl there is much talk about the advertisements that will be shown during the game. Turns out, in three of the last five years baseball’s World Series actually sold more advertising during its championship series than did the Super Bowl, with far less attention to the fact. But the baseball World Series is, of course, a series and not a single, super hyped game. There is no question that Super Bowl ads have become for many part of the show.

Today’s market size is the spending on network television advertising during the broadcasting of major sporting championships in 2011.

Enjoy the spectacle!

Geographic reference: United States
Year: 2011
Market size: Football – Super Bowl $228 million
Market size: Baseball – World Series $269 million (7 game series)
Market size: Basketball – NCAA Mens BB Final Four $170 (3 games)
Source: Jack Loechner, “Super Bowl Ad Stats,” a blog post on MediaPost, January 30, 2012, available here.
Original source: Kantar Media
Posted on February 4, 2012

Movie Theater Box-Office

Americans love movies but in the last few years we’ve been deciding more and more often to watch them at home or on-the-go and not in movie theaters. Technology has made that possible and theater ticket sales are declining as a result. In other words, attendance is down. While the number of tickets sold has declined, the revenue those tickets bring in is not dropping as quickly since ticket prices are rising.

Today’s market is the market for movie theater attendance in the United States and Canada in 1990, 2010 and 2011.

Geographic reference: United States and Canada
Year: 1990, 2010 and 2011
Market size: [tickets sold] 1.19, 1.34, and 1.28 billion respectively
Market size: [box-office] $5.02, $10.6 and 10.2 billion respectively
Source: “Movie Ticket Sales Slump: Theater Owners Try Booting Texters, Digital Upgrades, More Popcorn,” The Huffington Post, January 9, 2012, available here.
Original source: National Association of Theater Owners, the website for which is here.

Toys & Games

Today’s market size post is the size of the market for toys and games in 2007 based on total retail sales made in any retail outlet, from grocery stores and pharmacies to department stores and toy stores. For those wishing to investigate further, the market size posted here is based on the product category “toys, hobby goods and games” which is designated by the U.S. Census Bureau with the product code 20460.

Geographic reference: United States
Year: 2007
Market size: $90.55 billion
Source: “Sector 44: Retail Trade: Industry Series: Preliminary Product Lines Statistics by Kind of Business for the United States: 2007,” 2007 Economic Census, released on September 29, 2009available online here.
Original source: U.S. Census Bureau
Posted on December 21, 2011

Headphone Market

The arrival of a new, high-end, expensive and very fashionable headphone has stirred up the market for headphones. Headphones are a reasonably mature product segment which was infused with energy over recent years by earbuds that are commonly used with MP3 players of all sorts as well as cell phones and other small recording devices. But it was the arrival on the scene of the headphone, Beats by Dr. Dre, that reinvigorated the market most recently, the sales of which account for nearly a quarter of the market size listed below. Celebrity meets audio equipment and the market expands. Increased hearing loss in adolescents may be part of the unseen price being paid.

Geographic reference: United States
Year: 2011
Market size: $2 billion
Source: “Headphones With Swagger (and Lots of Bass),” The New York Times, Sunday, November 20, 2011, page B1, available online here. Also, “One in Five U.S. Adolescents Has Hearing Loss, Researchers Find,”
Bloomberg.com, August 17, 2010, available online here.
Original source: NPD Group and Journal of the American Medical Association
Posted on November 21, 2011