Smart Robots

smart robots
Smart robots have artificial intelligence systems that allow them to learn from their environment and experience. They are designed to do tasks without the supervision of humans but they can also collaborate with and work beside human beings and learn from human behavior. 1

Today’s market size shows the revenues from smart robots in 2017 and projected for 2025. Because of their accuracy and efficiency, smart robot adoption is significantly higher in the manufacturing, automotive, healthcare and retail industries. Smart robots for manufacturing dominated the industrial segment of the market in 2017. Smart vacuum cleaners constituted most of the residential segment. Growth in this segment is expected to come from increased demand for other types of smart household cleaning machines (mopping, lawn mowing, pool cleaning) as well as for smart vacuums.

Mobile robots and robots used in a healthcare setting comprise the majority of the professional services segment. Autonomous mobile robots can dynamically re-route themselves due to their advanced sensory and enhanced intelligence systems. As a result no special infrastructure alterations are needed to deploy these devices. This capability gives them an advantage over autonomous guided vehicles that have been used mainly for warehouse distribution and logistics applications. Smart robots used in a healthcare setting are helping doctors perform surgery, disinfecting hospital rooms, providing precise radiation therapy for cancer treatment, and transporting meals, linens, lab samples, waste and other items throughout hospitals. Smart robots such as PARO, a fuzzy, baby harp seal-shaped therapeutic robot, provide comfort, reduce stress, and help improve the socialization skills of people with dementia and similar conditions.

Since the outbreak of COVID-19, disinfection robots have been in high demand. Chinese hospitals have ordered more than 2,000 UVD robots from Blue Ocean Robotics alone. These robots move autonomously around patient and operating rooms using UV-C light to kill 99.99% of viruses and bacteria throughout the room in about 10 minutes. If a person enters the room, the robot automatically shuts off the UV-C light. A device such as this can also be used in offices, schools, shopping malls, airports, and manufacturing facilities.

Notwithstanding the demand caused by COVID-19, growth in the overall smart robot market is expected to be caused by several factors: increasing demand for service robots, increasing adoption of artificial intelligence and Internet of Things applications, falling prices due to innovation and a proliferation of the technology, and the use of robotics in mobile and other smart devices. Government and venture capital funding for smart robots and related technologies is also expected to enhance demand in the near future. Leading manufacturers include ABB Ltd; iRobot Corp.; Kuka AG; Fanuc Corp.; Yaskawa Electric Corp.; Panasonic Industry Europe GmbH; OTC Daihen Inc.; Kawasaki Heavy Industries; Intuitive Surgical Inc.; and Omron Adept Technologies, Inc.

1 See also our Collaborative Robots post.

Geographic reference: World
Year: 2017 and 2025
Market size: $4.06 billion and $17.56 billion, respectively
Sources: “Smart Robot Market by Component (Hardware and Software), Application (Welding & Painting, Assembling & Disassembling, Mobility, Inspection & Security and Others), Industry Vertical (Automotive, Manufacturing, Electrical & Electronic, Food & Beverage, Chemical, Residential, and Others) – Global Opportunity Analysis and Industry Forecast, 2018-2025,” Allied Market Research Report Overview, June 2018 available online here; “Smart Robots Market Size, Share & Trends Analysis Report by Component (Hardware, Software, Service), by Application, by End Use (Industrial, Commercial, Residential), by Vertical, by Region, and Segment Forecasts 2018-2025,” Grand View Research Report Summary, October 2018 available online here; “5 Medical Robots Making a Difference in Healthcare,” Case Western Reserve University, Case School of Engineering, December 28, 2017 available online here; “Executive Summary World Robotics 2019 Service Robots,” International Federation of Robotics, September 18, 2019 available online here; Bennett Brumson, “New Applications for Mobile Robots,” Robotics Industry Insights, April 5, 2012 available online here; Angela Johnston, “Robotic Seals Comfort Dementia Patients But Raise Ethical Concerns,” KALW, August 17, 2015 available online here; “Robots Help to Fight Coronavirus Worldwide,” International Federation of Robotics Press Release, March 31, 2020 available online here; “PARO Therapeutic Robot” available online here.
Image source: Pete Linforth, “connection-hand-human-robot-touch-3308188,” Pixabay, April 10, 2018 available online here.

Gold Nanoparticles

Gold nanoparticles in water

Gold nanoparticles are microscopic particles of gold measuring 1 to 100 nanometers in diameter. Due to their uniformity, conductance and optical properties, they have a variety of uses as sensors and catalysts and for biological imaging. Gold nanoparticles are also used in consumer electronics chip design as conductors and to connect resistors.

Colloidal gold—gold nanoparticles in a solution— has been used in health care since the fourth and fifth centuries B.C. in China, Arabia, and India. In Europe during the Middle Ages, Paracelsus, Swiss philosopher, alchemist, and astrologer, used it to treat mental illnesses and syphilis. Giovanni Andrea, a contemporary of Paracelsus, used colloidal gold to treat his patients’ leprosy, plague, epilepsy, and diarrhea.

In modern times, colloidal gold is used for photodynamic therapy, therapeutic agent delivery, and diagnostics. Photodynamic therapy, used to kill cancer cells, involves injecting a person’s bloodstream with colloidal gold. The gold particles stay in the tumor longer than in other cells. After a certain amount of time, the tumor is exposed to infrared light. The light causes the gold to heat up and kill the surrounding cancer cells.

In therapeutic agent delivery systems, also known as targeted drug therapy, the gold particles are coated with substances to treat a specific medical condition and targeting agents that will bind specifically to the tissue being treated. In some cases, the medication will only be activated by certain conditions in the body, for instance, a specific pH level. In this way, more of the medication gets to the area being treated than it would through traditional means of medication delivery such as oral ingestion or injection into the bloodstream. As a result, outcomes are better and side effects are minimized.

In addition, gold nanoparticles are used to diagnose heart disease, cancer, and infectious diseases by detecting biomarkers. Home pregnancy tests also use gold nanoparticles. The gold nanoparticles are coated with an antibody that detects one component of the hCG hormone, the one present in a woman’s urine when pregnant. When this hormone is present in high concentrations, it combines with the gold and the other hCG component on the test strip and the telltale red color becomes visible.

Today’s market size shows the total global revenues for gold nanoparticles in 2018 and projected for 2027. The health care and electronics sectors generated the most revenue. Use as a catalyst in chemical reactions garnered the third-highest revenue. Within the health care sector, targeted drug therapy and in-vivo imaging topped the end uses in 2018. They are expected to do likewise through 2027. Growth in gold nanoparticle revenue is expected over this time period due to increasing demand for consumer electronics, compact storage devices, and photovoltaic cells as well as growing research and development into improvements in biological imaging and in detecting and treating cancerous tumors. North America is expected to top demand for gold nanoparticles worldwide. Leading manufacturers include Agilent Technologies Inc., Hitachi Ltd., Tanaka Kikinzoku Kogyo K.K., and Danaher Corp.

Geographic reference: World
Year: 2018 and 2027
Market size: $2.52 billion and $10.15 billion, respectively
Sources: “Global Gold Nanoparticles Forecast 2019-2027,” Inkwood Research Report Summary available online here; “Gold Nanoparticles: Properties and Applications,” Millipore Sigma available online here; “Targeted Drug Delivery,” Wikipedia, September 28, 2019 available online here; Esther Inglis-Arkell, “What Do a Pregnancy Test and a Roman Goblet Have in Common?” Gizmodo, November 4, 2014 available online here; “Paracelsus,” Wikipedia, October 2, 2019 available online here; L.A. Dykman and N.G. Khlebtsov, “Gold Nanoparticles in Biology and Medicine: Recent Advances and Prospects,” Acta Naturae, April-June 2011, available online here; Aishwarya Nirmal, “A Color Spectrum Chart with Frequencies and Wavelengths,” Science Struck, January 29, 2018 available online here; “The Global Gold Nanoparticles Market Size is Expected to Reach USD 6.33 Billion by 2025,” Cision PR Newswire Press Release, October 1, 2019 available online here.
Image source: Gold nanoparticles dispersed in water. Different sized particles interact with light in different ways, hence the three colors. Nikonianman, “Au_nanoparticles,” Wikimedia Commons, [CC BY-SA 4.0], January 7, 2012 available online here. No changes were made to the original image.

Hearables

hearables

Do you own a smartphone? A smartwatch? Smart earbuds?

Hearables are wireless in-ear devices such as hearing aids, personal sound amplifiers, or earbuds, but instead of just amplifying or transmitting sound, they also sync with a smartphone or other smart device to allow the user to make phone calls, play music, or search the internet via voice, hands-free. Some of these devices are also able to monitor a person’s temperature, heart rate and calories burned, and track their steps. Smart hearing aids sync with smartphone apps in order to allow the user to adjust volume and tone and in some cases turn their hearing aids into headphones for phone calls and audio streaming.

Today’s market size shows worldwide hearable unit sales in 2018 and projected for 2020. In 2016, hearing aid revenue constituted the largest segment of the global hearables market. According to the World Health Organization, more than 5% of the world’s population suffers from hearing loss. Supported by a strong distribution network and audiologists who are increasingly recommending digitally programmable, customized smart hearing aids, demand for these devices is expected to grow through 2023.

In the United States, in August 2017, President Donald Trump signed into law the Over The Counter Hearing Aid Act. This law requires the Food and Drug Administration to regulate over-the-counter hearing aids to ensure they meet the same standards for safety, consumer labeling, and manufacturing that all other medical devices must meet. These regulations must be in place by August 2020. These types of hearing aids will be approved to treat mild to moderate hearing loss in adults. Those with hearing loss will not be required to visit an audiologist or another medical professional to obtain one. Although there are no over-the-counter hearing aid products on the market currently, once guidelines are in place this has the potential to expand the demand for smart hearing aids dramatically. An estimated 38 million Americans have untreated hearing loss.

On December 13, 2016, Apple released the first generation of AirPods, wireless Bluetooth earbuds that allowed users to make phone calls and interact with Apple’s digital assistant Siri. The newest generation of Apple AirPods, released in 2019, along with similar earbuds from other tech companies are expected to drive growth. In 2018, Apple sold an estimated 35 million AirPods, constituting 76% of the market. According to Counterpoint Research’s Consumer Lens study, in the United States, Apple was the preferred brand among consumers (19%), followed by Sony (17%), Samsung (16%), Bose (10%), and Beats (6%).

Geographic reference: World
Year: 2018 and 2020
Market size: 46 million and 129 million, respectively
Sources: Liz Lee, “True Wireless Hearables Sales to Climb to 129 Million Units Globally by 2020,” Counterpoint Press Release, March 15, 2019 available online here; Lindsey Banks, Au.D., “The Complete Guide to Hearable Technology in 2019,” Everyday Hearing, February 22, 2019 available online here; Lindsey Banks, Au.D., “The FIRST Made for iPhone Hearing Aids,” Everyday Hearing, July 2, 2016 available online here; “Hearable Devices Market Worth 23.24 Billion USD by 2023,” MarketsandMarkets Press Release, July 2017 available online here; “President Trump Signs OTC Hearing Aid Legislation into Law,” The Hearing Review, August 19, 2017 available online here; N.S. Reed, et. al., “Trends in Health Care Costs and Utilization Associated With Untreated Hearing Loss Over 10 Years,” JAMA Otolaryngology – Head Neck Surgery, U.S. National Library of Medicine, National Institutes of Health, November 8, 2018 available online here; “AirPods,” Wikipedia, April 8, 2019 available online here.
Original source: Counterpoint Research’s Emerging Technology Opportunities service.
Image source: Nicolas Sadoc [CC BY-SA 4.0], via Wikimedia Commons. Use of image does not constitute endorsement.

LED Drivers

LED driver
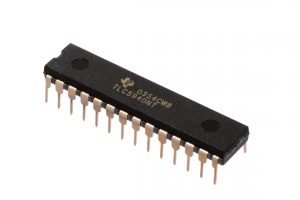
LEDs, or light-emitting diodes, produce light when current is run through semiconductor materials. In order for this to happen, LEDs need drivers to convert higher voltage, alternating current to lower voltage, direct current. LED drivers control the voltage and current flowing through the circuit at rated levels, protecting the LEDs from voltage and current fluctuations that can damage the LEDs.

Today’s market size shows the revenue generated from LED driver sales globally in 2015 and projected for 2021. According to the U.S. Department of Energy, LED residential lighting is 75% more energy efficient than incandescent bulbs and lasts 25 times longer. Increased demand for LED lighting in retail establishments, office complexes, and residences along with demand for LED streetlights is expected to drive the growth in the LED driver market through 2021. China’s and India’s recent focus on energy efficiency is expected to lead to a growth in the LED driver market for outdoor and traffic lighting. As rapid urbanization continues in several Asia Pacific countries, infrastructure demands will also provide a growing market for LED drivers.

Geographic reference: World
Year: 2015 and 2021 projected
Market size: $4.75 billion and $19.03 billion respectively
Sources: “LED Driver Market Size & Share to Exceed $19.03 Billion by 2021, Globally,” Nasdaq GlobeNewswire Press Release, January 12, 2018 available online here; “Understanding LED Drivers,” 1000Bulbs.com, May 2014 available online here; Maria Guerra, “5 Different Ways to Use LED Drivers, ” Electronic Design, September 15, 2016 available online here; and “LED Lighting,” Energy.gov, U.S. Department of Energy available online here.
Image source: By oomlout (IC-TLC5940) [CC BY-SA 2.0], via Wikimedia Commons. Use of the image does not constitute endorsement of brand.

Back-to-College Spending

According to the National Center for Education Statistics fall college enrollment in 2010 was 21.0 million. Enrollment declined to 20.2 million in 2014 but is projected to increase to 20.9 million in 2017. Today’s market size shows the total amount spent on back-to-college items by students and their families in 2010, 2014 and 2017. The figure for 2017 is projected. In 2017, back-to-college shoppers plan on spending the most on electronics ($12.8 billion), followed by clothing ($8.0 billion) and snacks and other food items ($7.5 billion). Spending on dorm and apartment furnishings came in fourth at $5.9 billion. Spending on school supplies ranked seventh at $3.9 billion.

Geographic reference: United States
Year: 2010, 2014 and 2017 projected
Market size: $45.88 billion, $48.48 billion and $54.18 billion respectively
Sources: Smith, Ana Serafin, “Back-to-School and Back-to-College Spending to Reach $83.6 Billion,” National Retail Federation Press Release, July 13, 2017 available online here; U.S. Department of Education, National Center for Education Statistics, “Table 303.10. Total Fall Enrollment in Degree-Granting Postsecondary Institutions, by Attendance Status, Sex of Student, and Control of Institution: Selected Years, 1947 through 2025,” Digest of Education Statistics: 2015, December 2016 available online here.
Original source: Prosper Insights & Analytics

Back-to-School Spending

School days, school days
Dear old Golden Rule days
Reading and ‘riting and ‘rithmetic
Taught to the tune of a hick’ry stick
You were my queen in calico
I was your bashful, barefoot beau
And you wrote on my slate, “I Love You, Joe”
When we were a couple o’ kids
— Chorus of the popular American song School Days written by Will Cobb and Gus Edwards in 1907

While reading, writing, and arithmetic are still part of the curriculum, back-to-school supplies have changed quite a bit over the past century or more. Slates have been replaced by notebooks, laptops, and tablets, supplies that are on many a child’s back-to-school shopping list this year along with clothing, shoes, calculators, folders, pencils, backpacks, and lunchboxes.

Today’s market size shows the amount spent on back-to-school items for children in kindergarten through 12th grade in 2007, 2016 and 2017. Figures for 2017 are projected. While parents and guardians do most of the back-to-school spending, the National Retail Federation found that preteens and teenagers plan on spending more of their own money on school supplies in 2017 than they have in the past.

Geographic reference: United States
Year: 2007, 2016 and 2017 projected
Market size: $18.48 billion, 27.38 billion and 29.58 billion respectively
Sources: Smith, Ana Serafin, “Back-to-School and Back-to-College Spending to Reach $83.6 Billion,” National Retail Federation Press Release, July 13, 2017 available online here; “School Days (1907 song),” Wikipedia, December 2016 available online here.