Summer Camp

Today’s market size is the estimated annual number of people attending an organized camping experience of the sort run by the nation’s roughly 12,000 camp organizations. Of these organizations, about two-thirds are non-profits and the rest are privately owned. Most of the people attending camps are children enrolled in summer camps, camps which are tending increasingly towards specializations such as a focus on a particular sport, an artistic pursuit (e.g. music) or an academic area of study (e.g. science).

Geographic reference: United States
Year: 2011
Market size: 11 million
Source: Natasha Singer, “When S’Mores Aren’t Enough,” The New York Times, July 10, 2011, page B1.
Original source: American Camp Association

e-Education—Students Enrolled in Online Courses

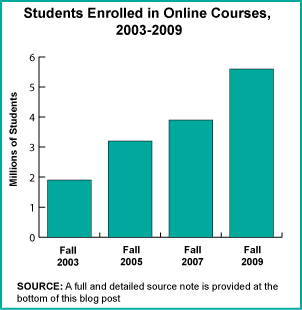
Enrollment in online courses

The number of students taking at least some of their classes online has risen steadily throughout the first decade of the 21st Century. In 2003, 11.2% of college and university students took at least one class online. By 2009, 27.4% did. The chart at the right shows the growth in the number of students enrolled in at least one online course in the Fall of each year.

Geographic reference: United States
Year: 2003 and 2009
Market size: Approximately 1.9 million and 5.6 million students respectively

Source: “Entering the Mainstream: The Quality and Extent of Online Education in the United States, 2003 and 2004,” [Abstract], Sloan Consortium, available online here; “Survey Reports: Online Education Grows by Almost a Million Students,” [Abstract], Sloan Consortium, available online here; “Table 176. Total Fall Enrollment in Degree-Granting Institutions, by Level of Enrollment, Sex, Attendance Status, and Type and Control of Institution: 2003,” Digest of Education Statistics: 2005, Spring 2004, available online here; “Table 202. Total Fall Enrollment in Degree-Granting Institutions, by Level of Enrollment, Sex, Attendance Status, and Type and Control of Institution: 2009,” Digest of Education Statistics: 2010, September 2010, available online here.

Graph Source: “Entering the Mainstream: The Quality and Extent of Online Education in the United States, 2003 and 2004,” [Abstract], Sloan Consortium, available online here; “Making the Grade: Online Education in the United States: 2006,” [Abstract], Sloan Consortium, available online here; “Staying the Course — Online Education in the United States, 2008,” [Abstract], Sloan Consortium, available online here; “Survey Reports: Online Education Grows by Almost a Million Students,” [Abstract], Sloan Consortium, available online here.

Librarian Corp

In an era which defines itself as the “Information Age,” it should come as no surprise that libraries have seen their usage numbers increasing annually for a decade. Today’s market size looks at the Librarian Corp—number of librarians working as librarians in the United States in 2008 and forecasted to be working in 2018 based on projections by the Bureau of Labor Statistics.

Geographic reference: United States
Year: 2008 and 2018
Market size: 159,900 and 172,400 respectively
Source: “Librarians,” Occupational Outlook Handbook, 2010-2011 Edition, December 3, 2010, available on the BLS web site here.
Original source: U.S. Department of Labor, Bureau of Labor Statistics

Student Loan Debt

The cost of a higher education has been rising for decades. According to an interesting article on this subject in EconSouth, the Federal Reserve Bank of Atlanta’s quarterly journal, students at four-year colleges and universities paid a national average of between $20,000 and $40,000 last year for tuition, books, and room and board. This range covers a great deal of variation based on geography and type of institution—public or private. It is the average for students living on campus and enrolled in a four-year degree program.

It costs a lot to get a degree these days and this cost is being paid by more people taking on greater and greater levels of debt. Today’s market size is the total debt outstanding, nationally, for student loans. This figure exceeded, for the first time ever in 2010, the national total debt outstanding for revolving credit.

Geographic reference: United States
Year: 2010
Market size: $829.79 billion
Source: “Cap in Hand—The High Price of Higher Education,” EconSouth, first quarter 2011, page 8.
Source: Federal Reserve Bank of Atlanta, College Board, and FinAid.org

Educational Services

The educational services covered in today’s market size post are all those not part of the traditional school system—elementary schools, secondary schools, colleges and universities. Think instead of all the other training and educational services that people may need. This market includes all those teaching and training people who wish to learn a new language; learn how to drive; learn how to cut and style hair; learn how to fix cars, leaky pipes, and/or computers; and learn how to be a better nanny, manager, secretary, etc.

This market size is based on estimated annual revenues.

Geographic reference: United States
Year: 2009
Market size: $42.9 million
Source: “Table 12.1. Educational Services (NAICS 61) – Estimated Revenue for Employer Firms: 2009,” 2009 Service Annual Survey, February 2011, available online here.
Original source: U.S. Census Bureau

Historically Black Colleges & Universities

Historically Black Colleges and Universities (HBCUs) account for only 20% of African-American college students and yet 40% of engineering degrees earned by African-Americans are earned at HBCUs. “Similarly, of the 21 undergraduate producers of African American science PhDs, 17 were HBCUs.”

Geographic reference: United States
Year: 2010
Market size: 105 HBCUs serving over 300,000 undergraduates and graduate students.
Source: Muhammad, Jesse, “Despite Critics, HBCUs Still Relevant,” The Charlotte Post, February 19, 2011, St. Thomas, Virgin Islands.
Original source: U.S. Commission on Civil Rights report “The Educational Effectiveness of Historically Black Colleges and Universities.” The Department of Education provides a list of HBCUs here.

Market for Art Instruction

The market for fine arts instruction has grown quite substantially over the last decade or so. In 1997 there were 1,009 establishments in the United States engaged primarily in offering instruction in the fine arts. By 2007 that number had risen to 11,478. The Census Bureau’s definition of this industry is as follows: “This industry comprises establishments primarily engaged in offering instruction in the arts, including dance, art, drama, and music.”

Geographic reference: United States
Year: 1997 and 2007
Market size: $388.5 million and $3.25 billion respectively
Source: “2007 Economic Census: Sector 61: Educational Services: Industrial Series: Preliminary Comparative Statistics for the United States 2007 and 2002,” July 31, 2009, available online here. The data for 1997 were taken from the “1997 Economic Census.”
Original source: U.S. Bureau of the Census

Language Schools

The size of the market for foreign language instruction has seen a significant rise in the United States over the last decade. This is likely the result of the growing globalization of economic activity. The size listed here is the size of the revenues obtained by establishments primarily engaged in the teaching of foreign languages, including sign language.

Geographic reference: United States
Year: 1997 and 2007
Market size: $75.34 million and $857.96 million respectively
Source: “2007 Economic Census: Sector 61: Educational Services: Industrial Series: Preliminary Comparative Statistics for the United States 2007 and 2002,” July 31, 2009, available online here as well as the “1997 Economic Census” data on the same industry.
Original source: U.S. Bureau of the Census

Driving Schools

The ability to drive an automobile is an important part of living in the United States. This is true everywhere other than a few large cities in which mass transit offers a practical option for getting around. Yet the training of young people to drive, which was once done by public schools, has been privatized. Slowly, school district by school district, this service has been outsourced to private firms and students in these districts must now pay a significant fee to be trained to drive.

In 1997 there were 56 establishments primarily engaged in offering automobile driving instruction in the United States. By 2007 that number had risen to 2,261 establishents. Businesses engaged in training truck drivers are not included in this number.

Geographic reference: United States
Year: 1997 and 2007
Market size: $30.4 million and $638.1 million respectively
Source: “2007 Economic Census: Sector 61: Educational Services: Industrial Series: Preliminary Comparative Statistics for the United States 2007 and 2002,” July 31, 2009, available online here as well as the “1997 Economic Census” data on the same industry.
Original source: U.S. Bureau of the Census

Computer Training Centers

The number of educational service providing establishments in the United States grew by 20% between 2002 and 2007, from 49,319 establishments to 61,385. However, the number of establishments dedicated to doing computer training—from how to use computers to networking and programming them—actually fell during the period. While this may have been explained by there having been a consolidation within the sector, fewer but larger establsihments, it turns out that was not the case. Employment within this particular sector of educational services—computer training—also fell, from 29.3 thousand to 17.4 thousand.

Geographic reference: United States
Year: 2002 and 2007
Market size: 2,988 and 2,211 establishments respectively
Source: “2007 Economic Census: Sector 61: Educational Services,” June 29, 2010, available online here.
Original source: U.S. Bureau of the Census