Dropshipping

dropshipping e-commerce
The rise in e-commerce has fueled the increasing demand for dropshipping.
Geographic reference: World
Year: 2018 and 2025
Market size: $102.2 billion and $557.9 billion, respectively

Today’s market size shows total global revenues for dropshipping services in 2018 and projected for 2025. Dropshipping is a retail fulfillment service; however, the retailer does not keep a stock of inventory. The retailer transfers the customer order to the manufacturer or wholesaler who then ships the items to the customer directly on behalf of the retailer. The retailer charges the customer for the items and the manufacturer or wholesaler charges the retailer for the items. As with any retail transaction, each party marks up the price of the item to make a profit.

The growth in dropshipping services is fueled by the growth in online shopping. From 2016 to 2020, worldwide e-commerce sales grew from $1.8 trillion to $4.3 trillion. The proliferation of smartphones has pushed mobile commerce sales from $0.97 trillion to $2.91 trillion over this same time period, with a 22.3% jump in sales predicted for 2021. 

Dropshipping has many advantages for aspiring entrepreneurs: the ability to test different business ideas and learn how to choose and market products, less capital investment, low overhead, flexible location, and easier scaling of the business. But, dropshipping also has many drawbacks. Because a retailer will have competing stores selling similar or identical products at low prices, profit margins most of the time will be low. Inventory issues may also arise as inventory can change daily and be out of the retailer’s control if it deals with a supplier or multiple suppliers that are also working with other clients. If a retailer does work with multiple suppliers, calculating shipping prices on orders can be complex. And, if something goes wrong with the fulfillment of an order, the retailer may have to take the blame, apologize, and refund the customer’s money even if the problem lies solely with the supplier. As a consequence, a retailer’s business reputation may be damaged through no fault of its own. After weighing the pros and cons, 27% of online retailers have decided to use dropshipping as of 2021. 

By product, electronics garnered the largest revenue share in 2018. The food and personal care segment is projected to grow at a 30% compound annual growth rate through 2025 as consumers increasingly buy skincare products, perfumes, cosmetics, and personal care products online. The fashion segment is also projected to have significant growth over this time period. The popularity of branded products and the ability to shop for several brands on a single platform will drive growth in this area. In addition, the luxury furniture segment is expected to experience considerable growth through 2025.

The Asia-Pacific region claimed a 25% revenue share in 2018. An increasing number of e-commerce companies in the region is driving demand for dropshipping services. A rise in the number of e-commerce startups in India, for example, will fuel demand for dropshipping services as these services allow startups, especially those with limited resources, to focus on marketing to compete better with larger, more established retailers. North America is expected to experience considerable growth through 2025 as mobile commerce and voice-enabled virtual assistant purchases become more common. Easy ordering and returning will also spur e-commerce sales which will, in turn, create demand for dropshipping.

The dropshipping market contains many small and medium-sized firms, with a few large global companies. These include AliDropship, Doba Inc., SaleHoo Group Ltd., and Oberlo. In 2017, Shopify Inc., an e-commerce platform, acquired Oberlo to improve its market share. Several other major e-commerce companies have expanded their services to offer dropshipping to manufacturers and wholesalers.

Sources: “Dropshipping Market Size, Share & Trends Analysis Report by Product (Toys, Hobby & DIY, Furniture & Appliances, Food & Personal Care, Electronics & Media, Fashion), by Region, and Segment Forecasts, 2019 – 2025,” Grand View Research Report Summary, December 2019 available online here; “Dropshipping Market Size Worth $557.9 Billion by 2025 | CAGR: 28.8%: Grand View Research, Inc.,” CISION PR Newswire, January 20, 2020 available online here; “Mobile Commerce Sales in 2021,” Oberlo available online here; Tugba Sabanoglu, “Retail E-commerce Sales Worldwide from 2014 to 2024,” Statista, March 26, 2021 available online here; Corey Ferreira, “What is Dropshipping?” Shopify Blog, January 1, 2021 available online here; Olusola David, “20+ Dropshipping Statistics & Facts 2021 [Full Analysis Report],” Torchbankz, January 4, 2021 available online here.
Image source: rupixen, “payment-online-payment-card-payment-4334491,” Pixabay, July 13, 2019 available online here.

E-Pharmacies

e-pharmacies
E-pharmacies, also known as online pharmacies or mail-order pharmacies, are pharmacies that conduct business over the internet through a website or secure web portal. They send orders of both prescription and non-prescription drugs to customers via the mail or through shipping companies. In 2018, the majority of revenues at e-pharmacies came from over-the-counter medications.

In the United States, legitimate e-pharmacies require a valid prescription from a doctor or other health care professional before dispensing prescription drugs. They are licensed by the appropriate state agency and have a licensed pharmacist available to answer questions. They must also provide a street address. In many cases, e-pharmacy services are part of a person’s health insurance benefits. For example, OptumRx, Express Scripts, and CVS Caremark are affiliated with the UnitedHealth Group, Cigna, and Aetna health insurance companies, respectively.

Because prescription drug prices are high, some people turn to illegal pharmacies. Illegal pharmacies may send an unsolicited email offering medicine at a deep discount. These pharmacies are not licensed and allow people to buy prescription medication without a valid prescription from a health care provider. Buying pharmaceuticals from these types of businesses is risky. The medicines ordered may have too much or too little of the active ingredient, not contain the right active ingredient or contain harmful ingredients. An estimated 10% of medications available worldwide are counterfeit. In India and developing countries in Africa, Asia, and Latin America more than 30% are.

The European Medicines Agency is currently warning consumers to avoid online pharmacies that falsely claim that a product they sell can treat or prevent COVID-19. The U.S. Food and Drug Administration (FDA) and the Federal Trade Commission issued warnings to 7 companies and shut down dozens that claimed their products do the same. Currently, there are no approved medications to treat or prevent COVID-19 and there are no vaccines available.

Today’s market size shows worldwide e-pharmacy revenues for 2018 and projected for 2025.1 In 2018, 11% of adult pharmacy customers obtained their prescriptions from e-pharmacies. Since the outbreak of the COVID-19 pandemic, some online pharmacies have been seeing a surge in orders as people decide to avoid public places such as brick-and-mortar pharmacies and instead order their medications online. Whether these new e-pharmacy consumers will continue to order their medication in this way once the pandemic is over and life returns to normal is yet to be seen.

North America is the largest market for e-pharmacies and is expected to continue to be through 2025 due to the growing number of internet users coupled with their familiarity with using online services. A growing awareness of e-pharmacies, especially ones affiliated with large companies, as well as government campaigns meant to educate consumers about how to spot illegal e-pharmacies are also expected to contribute to North America’s domination of the market. Leading global e-pharmacy companies include The Kroger Co., The Walgreen Co., Express Scripts Holding, CVS Health, Doc Morris, Giant Eagle, Wal-Mart Stores, OptumRx, 1mg, and Netmeds.

1 Revenues are for legal businesses only.

Geographic reference: World
Year: 2018 and 2025
Market size: $42.32 billion and $107.53 billion, respectively
Sources: “Global Share of E-Pharmacy Market Size to Surpass USD 107.53 Billion by 2025,” Zion Market Research Press Release, July 26, 2019 available online here; “Online Pharmacy,” Wikipedia, March 7, 2020 available online here; “How to Buy Medicines Safely From an Online Pharmacy,” U.S. Food and Drug Administration, January 25, 2018 available online here; Hannah Balfour, “EMA Warns Consumers About Falsified COVID-19 Drugs from Online Pharmacies,” European Pharmaceutical Review, March 31, 2020 available online here; Hannah Balfour, “FDA and FTC Issue Warning Letters to Companies Selling Fraudulent COVID-19 Products,” European Pharmaceutical Review, March 10, 2019 available online here; András Fittler, PharmD, PhD, et. al., “Consumers Turning to the Internet Pharmacy Market: Cross-Sectional Study on the Frequency and Attitudes of Hungarian Patients Purchasing Medications Online,” Journal of Medical Internet Research, August 22, 2018 available online here; Matt Baron, “COVID-19 Sparks Surge in U.S. Online Pharmacy Purchases,” Patch, April 3, 2020 available online here.
Image source: National Cancer Institute, “A Male Pharmacist is Examining a Drug from the Pharmacy Inventory,” Unsplash, January 29, 2020 available online here.

E-Commerce in Pakistan

Pakistani rupeeAs a percentage of total retail sales in the country, Pakistan’s e-commerce market is quite small, 0.34%, but is expected to grow as adoption of technology becomes more widespread. As of January 2018, there were 52 million subscribers to broadband internet, up from 44.5 million a year before. The number of online payment merchants increased nearly 60% during this time period, from 571 to 905. Banks are starting to allow debit and credit cards to be used for online purchases. However, fewer people have bank accounts than have broadband internet. And, fewer still—21.1 million— have either a debit or a credit card. Currently, 4 out of 5 online orders are cash on delivery. Several online payment gateways allow nearly every Pakistani to pay for their online purchases with cash.

Today’s market size shows the amount of e-commerce revenue in fiscal year 20171 and the projected revenue for fiscal year 2018. According to Adam Dawood, head of Yayvo, an online shopping portal, the most growth will be seen in areas that currently are the biggest inconvenience for customers, such as ordering bus tickets or obtaining national ID cards. Pakistanis no longer have to wait in line. They can now do these things online.

1Pakistan’s fiscal year is from July 1 to June 30.

Geographic reference: Pakistan
Year: FY 2017 and FY 2018 projected
Market size: $622 million and $1 billion respectively
Sources: Usman Sheikh, “Pakistan’s E-Commerce Market Size Set to Cross $1B This Year,” The Express Tribune, March 19, 2018 available online here; “Economy of Pakistan,” Wikipedia, April 11, 2018 available online here.
Image source: By Babloyi [CC BY-SA 3.0 or GFDL], from Wikimedia Commons

E-Commerce in India

E-CommerceSales in India’s overall retail sector totaled Rs 49 trillion during the 2017 fiscal year.1 Small to medium-sized independent businesses and mom-and-pop type stores make up the greatest share of this market, with chain stores, franchises, and large stand-alone stores making up a mere 7%. The e-commerce sector has an even smaller share, 1.5%, despite its share tripling in the three years prior. Currently, three-quarters of total e-commerce sales come from major cities in India.

Today’s market size shows the total e-commerce revenue earned in India in the 2017 fiscal year and projected earnings for fiscal year 2020. The largest segments of e-commerce in India are the apparel, mobile phone, and grocery sectors. In the next three years, the grocery sector is expected to grow the fastest, quadrupling its revenue to Rs 100 billion by fiscal year 2020. In 2017, Amazon, Flipkart, D-Mart and Reliance joined established online grocers BigBasket and Grofers to offer groceries online.

1 India’s fiscal year runs from April 1 to March 31.

Geographic reference: India
Year: FY 2017 and FY 2020 projected
Market size: Rs 700 billion and Rs 1.8 trillion respectively
Sources: ZeeBiz WebTeam, “E-Retail Market Size to Surge 250% in the Next 3 Years,” ZeeBusiness, February 19, 2018 available online here; “Unorganized and Organized Retail: A Global Comparison,” Reurbanist, August 22, 2012 available online here; Surojit Gupta, “Govt Will Not Change Fiscal Year for Now,” The Times of India, September 25, 2017 available online here.
Image source: geralt, “e-commerce-shopping-basket-shopping-402822,” Pixabay, July 27, 2014 available online here.

Online Grocery-Delivery Services

For many years people have been buying books, clothing, and housewares online. Why not groceries? The grocery industry in the United States generates more than $600 billion in sales. Nearly everyone shops for groceries and an overwhelming majority shop for groceries at least once a week. Online grocery-shopping services offer the consumer convenience, but many times this convenience comes at a price. Because the consumer is paying someone else to shop for them, in order to pay these employees companies may charge higher prices for the groceries themselves and charge for shipping or delivery. Also, the consumer has to trust that the online grocery-shopping service employees will select the best produce, meat, and other perishable items and deliver them to their door in a timely manner and in good condition.

Despite many of the drawbacks, consumers are spending billions shopping online for groceries. Today’s market size is the total amount consumers in the United States spent online for groceries in 2016, a more than 160% increase in spending over 2015. Also included are projected sales figures for 2025.

Geographic reference: United States
Year: 2016 and 2025
Market size: $42 billion and more than $100 billion respectively
Sources: Trejos, Nancy, “Hotels Find Alternatives to Room Service,” USA TODAY for the Lansing State Journal, August 14, 2017, page 5B; Kestenbaum, Richard, “Why Online Grocers are So Unsuccessful and What Amazon is Doing About It,” Forbes, January 16, 2017 available online here.
Original source: Morgan Stanley
Image source: JoyintheCommonplace, “List-plan-phone-to-do-list-1474674,” Pixabay, June 23, 2016 available online here. Original image has been modified.

International Data Flow

The World Wide Web. A decentralized network of data stored on servers all around the world. But many countries—China, Russia, Germany, and Belgium, to name a few—are enacting laws requiring multinational companies to store and process country-specific data on local servers. According to the source, relaxing such restrictions has become a priority of President Donald Trump’s administration as they negotiate trade agreements, including the upcoming renegotiation of NAFTA.
Proponents of these laws say that having their users’ data stored locally aids in cyber security. Opponents say that storing data on local servers is more expensive, especially for small to medium sized companies. High tech companies worry about having their source codes stolen. Some companies worry that governments or political groups will use the data stored on these servers for illegitimate reasons. And many argue that limiting data flow also limits job growth and innovation. According to Nigel Cory, a trade policy analyst at the Information Technology and Innovation Foundation, “data needs to flow to create value.”

Today’s market size is the estimated value of data flowing through international borders in 2014, according to a report by the McKinsey Global Institute.

Geographic reference: World
Year: 2014
Market size: $2.8 trillion
Sources: Yu, Roger, “More Firms Push Back on Foreign Data Rule,” USA TODAY for the Lansing State Journal, August 13, 2017, page 4B
Original source: Manyika, James, et. al., Digital Globalization: The New Era of Global Flows, McKinsey Global Insitute, February 2016 available online here.
Image source: Geralt, “Binary-hands-keyboard-tap-enter-2372131,” Pixabay, June 2017 available online here.

Nonstore Retail Sales

Nonstore

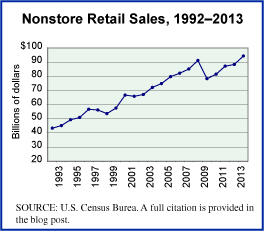
We hear a lot today about e-commerce, which may be defined in many ways and has been around for longer than most people think if we include exchanges made at the wholesale trade level as a part of e-commerce. Wholesalers have been using electronic sales for a long time now. But e-commerce is not actually synonymous with nonstore retail. While electronic shopping accounts for a great deal of the total nonstore retail business, nearly 80% in 2013 when combined with mail-order house sales, there are others in this nonstore sector.

The total nonstore retail sector includes, as we’ve seen, electronic shopping and auction websites and mail-order houses. It also includes businesses that do their selling with infomercials on TV, by going door-to-door, through the use of in-home demonstrations, those that sell from portable stalls or food trucks, and those operating vending machines. The graph we present shows annual sales by nonstore retailers other than electronic shopping, auctions, and mail-order houses.

Today’s market size is the total value of sales made in the United States through nonstore retailers in 2000 and in 2013.

Geographic reference: United States
Year: 2000 and 2013
Market size: $180.5 billion and $450.2 billion
Source: “Time Series / Trend Charts,” a new interactive resource made available by the U.S. Census Bureau using its wealth of data collected in a monthly survey series it does of the retail trade sector. The main website for the “Monthly and Annual Retail Trade” data is here and the new Time Series / Trend Chart offering is available online here.
Original source: U.S. Census Bureau
Posted on March 13, 2014

Digital Ad Spending

Measuring the world of advertising is tricky and when it comes to how much is spent on digital advertising, the task becomes harder yet. Part of the difficulty has to do with how one defines the market being measured, as is always the case when dealing with market sizes. But, in the case of an industry that is still forming and evolving, definitions are crucial. Clear definitions of what is being measured are not always provided by those reporting on these markets or those reporting on those reports. So use this market size data as a general guide to a market whose boundaries are a bit… fluid.

Today’s market size post is the size of the market for digital advertising based on two estimates of how much will be spent worldwide on digital advertising in 2013. The range presented is made up of the two estimates, sources for which are also provided. Worth noting is the fact that these estimates place spending on digital advertising at around one-fifth of the spending on all advertising.

Geographic reference: World
Year: 2013
Market size: $95 to $117 billion
Source: John Bussey, “When Google Brainstorms, The Online World Shudders,” Wall Street Journal, September 27, 2013, page B1. Michael Sebastian, “Ad Spending Forecast Revised Downward,” AdAge, August 14, 2013, available online here.
Original source: eMarketer and GroupM
Posted on October 9, 2013

Trade Books

The Association of American Publishers (AAP) tracks the sales of its members. It has had an increasingly difficult task in tracking sales over the last decade or so, as the industry deals with dramatic changes in distribution networks (bookstores), in the product itself (print versus digital) and in the rise of self-publishing. The AAP report on 2012 sales shows a 7.4% improvement in the sale of trade books over 2011. Trade books are defined as those intended for general readership and are sold through a general retail outlet—whether fiction or nonfiction, print or e-book, and/or brick-and-mortar stores or online sales. The total value of trade book sales in 2012 was, however, far short of that reached in 2007, the peak year for sales during the first decade of the new century.

Today’s market size is based on the sale of trade books, published by the large and middle-sized American book publishers—AAP members—in 2007 and 2012.

Geographic reference: United States
Year: 2007 and 2012
Market size: $8.53 billion and $6.53 billion respectively
Source: “Today’s Lunch: Weak December Doesn’t Spoil 2012 Trade Gain of 7.4 Percent,” article in the April 11, 2013, Publishers Lunch newsletter. Access to the newsletter’s website is here. The data on 2007 sales comes from “Association of American Publishers 2009 S1 Report — Estimated Book Publishing Industry Net Sales 2002-2009,” available online here.
Original source: Association of American Publishers
Posted on April 12, 2013

E-Commerce Writ Large

Sector Pie Chart

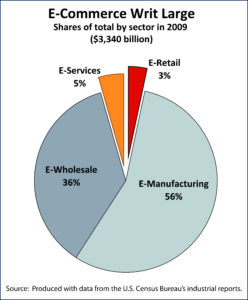
The announcement this week that two large players in the Internet world have made billion dollar plus acquisitions made us think again about e-commerce. It is a term that is used regularly but one suspects that its meaning is somewhat subjective and based on the user’s own concept of the business. E-commerce can be viewed, as it often is, as electronic shopping. Of course, that might more accurately be called e-shopping or e-retail. Commercial exchange is much bigger than that.

By taking the electronically transacted portions of each of the primarily commercial sectors of the economy, we see (in the pie chart) that e-retail makes up only a small share of the more broadly defined e-commerce. E-wholesale and e-manufacturing account for the lion’s share of the total but they are not new and shiny and so attract far less media attention or investor interest.

Even within the retail sector as a whole, e-commerce accounts for just under 5 percent of the whole. That percentage is, of course, growing, and growing rapidly. It is this fact that must be causing companies like Facebook to spend in excess of $1 billion on a company with a popular photo-sharing app (Instagram). Worth noting is the fact that in some retail sectors, e-commerce does play a far larger role than the 5 percent it represents of the sector at large: electronics and books are two such.

Today’s market size numbers measure the size of the U.S. retail sector in the 4th quarter of 2011, and the size of the e-commerce portion of that total.

Geographic reference: United States
Year: 2011, 4th quarter
Market size: Retail, $1.072 trillion, E-commerce: $51.38 billion (4.8% of total retail)
Source: Quarterly Retail E-Commerce Sales, 4th Quarter 2011, U.S. Census Bureau, available online here.
Original source: U.S. Department of Commerce, Bureau of the Census
Posted on April 11, 2012

E-Commerce Sales on Cyber Monday

The estimate of how much is sold on a single day is of limited use to anyone but it is something reported on and tracked by the retail industry. And when that day is either the day after Thanksgiving or, for the online world, the Monday following Thanksgiving, interest in the estimates is particularly high as they are believed to foreshadow the level of retail sales for the rest of that year.

Today’s market size is an estimated range of the total sales generated by e-commerce websites on Monday, November 28, 2011.

Geographic reference: World
Year: Nov. 28, 2011
Market size: $1.17 to $1.2 billion
Source: Claire Cain Miller, “A Shopping Day Invested for the Web Comes Alive,” The New York Times, Nov. 29, 2011, page B1, available online here.
Original source: comScore and IBM Benchmark
Posted on December 8, 2011

Online Poker

Gambling moved onto the Internet as soon as a reliable means of exchanging funds was available on that network. One could call this industry an early adopter of e-commerce. The rules of the game, however, are not always clear and vary from country to country and jurisdiction to jurisdiction which complicates things for a system that spans geographies. Nonetheless, according to those following the market, it is a lucrative one.

Today’s market size is an estimated total number of dollars gambled through online poker sites by Americans in 2010.

Geographic reference: United States
Year: 2010
Market size: $16 billion
Source: Janet Morrissey, “Poker Inc. To Uncle Sam: Shut Up and Deal,” The New York Times, October 9, 2011, page B1, available online here.
Original source: PokerScout.com
Posted on October 18, 2011

Streaming Video

Netflix and Hulu are two services that allow their customers to stream videos. A March 2011 Nielsen survey found that a majority of Netflix users who stream videos watch them on their TVs through gaming consoles, while a majority of Hulu users stream video on their computers.

Data are the number of videos streamed in the United States in May 2011. This was an all-time high.

Geographic reference: United States
Year: May 2011
Market size: 15 billion videos
Source: The Associated Press, “Half of Netflix Use Done on Consoles,” Lansing State Journal, July 31, 2011, page 4E

e-Education—Students Enrolled in Online Courses

Enrollment in online courses

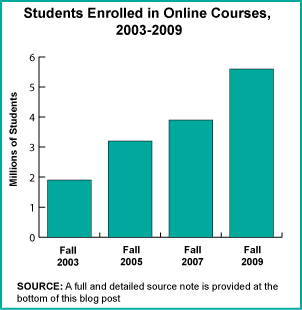
The number of students taking at least some of their classes online has risen steadily throughout the first decade of the 21st Century. In 2003, 11.2% of college and university students took at least one class online. By 2009, 27.4% did. The chart at the right shows the growth in the number of students enrolled in at least one online course in the Fall of each year.

Geographic reference: United States
Year: 2003 and 2009
Market size: Approximately 1.9 million and 5.6 million students respectively

Source: “Entering the Mainstream: The Quality and Extent of Online Education in the United States, 2003 and 2004,” [Abstract], Sloan Consortium, available online here; “Survey Reports: Online Education Grows by Almost a Million Students,” [Abstract], Sloan Consortium, available online here; “Table 176. Total Fall Enrollment in Degree-Granting Institutions, by Level of Enrollment, Sex, Attendance Status, and Type and Control of Institution: 2003,” Digest of Education Statistics: 2005, Spring 2004, available online here; “Table 202. Total Fall Enrollment in Degree-Granting Institutions, by Level of Enrollment, Sex, Attendance Status, and Type and Control of Institution: 2009,” Digest of Education Statistics: 2010, September 2010, available online here.

Graph Source: “Entering the Mainstream: The Quality and Extent of Online Education in the United States, 2003 and 2004,” [Abstract], Sloan Consortium, available online here; “Making the Grade: Online Education in the United States: 2006,” [Abstract], Sloan Consortium, available online here; “Staying the Course — Online Education in the United States, 2008,” [Abstract], Sloan Consortium, available online here; “Survey Reports: Online Education Grows by Almost a Million Students,” [Abstract], Sloan Consortium, available online here.

Digital Publishing Market

UK books

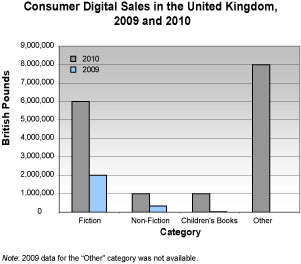
Data show combined digital sales in the United Kingdom, including academic, professional, school, and consumer digital downloads and e-books. Academic and professional digital sales accounted for £84 million. Consumer sales, which includes fiction, non-fiction, and children’s books, were £16 million. Of that £16 million, e-book sales accounted for £13 million. The graph to the right breaks down consumer digital sales by category.

Geographic reference: United Kingdom
Year: 2010
Market size: £120 Million
Source: Philip Jones, “Digital Sales Now Worth 6%, as E-books Grow 300% in 2010,” TheBookseller.com, March 5, 2011 available online.
Original source: Publishers Association

e-Filing in the United States

Individual income tax returns were due for 2010 yesterday. A large number of these tax returns are now filed electronically. In 2010 e-filing accounted for 69.3% of all individual income tax forms filed for the tax year 2009. Today’s market size is the number of those returns filed as of December 31, 2010. The IRS expects this figure to rise for coming tax years. Of the returns filed electronically last year, 35.3% were filed by the filer him or herself and the remaining 64.7% were filed by a professional preparer.

Geographic reference: United States
Year: 2010
Market size: 98,740,000 individual tax returns for tax year 2009
Source: “2010 Filing Season Statistics,” an online report made available online by the
IRS here.
Original source: U.S. Internal Revenue Service

App Store Sales

We hear a lot about “apps” these days, or application programs. But what are they, really. These are computer programs designed as standalone software to run on a variety of devices, usually mobile devices. These apps are sold through online stores and usually have a well defined and somewhat limited purpose. They usually have a filename extension “.app” for use on mobile operating systems such as Android; iOS (Apple); Linux; MeeGo; Microsoft Mobile; RIM (BlackBerry); and Symbian.

Apps are a class of products whose market is based on volume. The average price of an app is around $2.50, (reached with a lot sold for 99¢ and a few sold for $9.00 plus) so a whole lot of apps had to sell in order to reach the market size presented below. There are 5 billion mobile device subscribers worldwide, according the the International Telecommunications Union (ITU). Now, all mobile devices are not “smart” devices and thus are not equipped to run apps. Nonetheless, based on the fact that an estimated 10% of these 5 billion devices are smart we can calculate, very generally, that each one of these smart device owners bought just under two apps in 2010. There seems room for growth here…

As a side note, that figure of 5 billion mobile device subscribers is rather noteworthy given that the world population in 2010 was just shy of 7 billion. Food for thought.

Geographic reference: World
Year: 2010
Market size: $2.15 billion
Source: Whitney, Lance, “Report: Apple Remains King of App Store Market,” CNET News, February 15, 2011, available online here. Also, press release from the ITU which is available online here.
Original source: IHS Screen Digest, February 2011

Online Sale of Computers—Hardware & Software

Selling computers and software online seems pretty natural, after all, the buyer is using a computer to make the purchase. This may explain why the growth rate of online sales of this line of merchandise was not quite as robust between 2003 and 2008 as the growth rate for other lines of merchandise—clothes, sporting goods, food, beer and wine, and appliances to name a few lines, each with an online sales growth rate over 200%. Selling computers online has been underway since the 1990s whereas online sales of other lines of merchandise have only moved onto the Internet in a big way since the early 2000s.

Geographic reference: United States
Year: 2003 and 2008
Market size: Sales: $7.8 and $14.3 billion respectively, an increase of 84%.
Source: “Table 1055. Electronic Shopping and Mail-Order Houses—Total and E-Commerce Sales by Merchandise Line,” Statistical Abstract of the United States: 2011, U.S. Census Bureau, page 663, available online here in a spreadsheet format, and here as a PDF file.
One word of clarification to help prevent any confusion about just what is being presented here. The data in the source table are provided in two columns per year, the first one called “Total,” and the second is “E-Commerce”. The column headed “Total” refers to the total sales for the industry “Electronic Shopping and Mail-order Houses,” [NAICS 4541], and the second column is the e-commerce portion of that industry’s total. Do not confuse the “Total” column for a measure of total sales of the product line listed in that row. It is, rather, the total sales of that product line made electronically and through mail-order houses.
Original source: U.S. Department of Commerce, Bureau of the Census.

By the way, for anyone not familiar with the Statistical Abstract of the United States, a wonderful compilation of a huge variety of important measures of the United States, learn about it here. It is a great place to start with any investigations about the U.S. economy, business climate, people, government, and many more things yet.

Online Sale of Clothes and Shoes

The market size presented here is the total value of clothing and shoes that were sold electronically in 2003 and 2008. It is interesting to see that online sales of clothes and shoes have grown briskly over this five-year period since it was believed that such merchandise would be harder to sell online than other things, things that people would not wish to try on before purchasing. Four Census Bureau product codes are included in this market size calculation, they are 20200 (Men’s wear); 20220 (Women’s wear); 20240 (Children’s clothes), and 20260 (Footwear).

Geographic reference: United States (based on the location of the selling entity)
Year: 2003 and 2008
Market size: Sales: $5.13 and $17.06 billion respectively, representing a 233% increase.
Source: “Table 1055. Electronic Shopping and Mail-Order Houses—Total and E-Commerce Sales by Merchandise Line,” Statistical Abstract of the United States: 2011, U.S. Census Bureau, page 663, available online here in a spreadsheet format, and here as a PDF file.
One word of clarification to help prevent any confusion about just what is being presented here. The data in the source table are provided in two columns per year, the first one called “Total,” and the second is “E-Commerce”. The column headed “Total” refers to the total sales for the industry “Electronic Shopping and Mail-Order Houses,” [NAICS 4541], and the second column is the e-commerce portion of that industry’s total. Do not confuse the “Total” column for a measure of total sales of the product line listed in that row. It is, rather, the total sales of that product line made electronically and through mail-order houses.
Original source: U.S. Department of Commerce, Bureau of the Census.

Online Sale of Furniture

Today we will present the first in a series of market sizes based on the online sale of a particular line of merchandise. The online sale of furniture is our market for today.

Geographic reference: United States
Year: 2003 and 2008
Market size: Sales: $3.1 and $9.8 billion respectively, representing a 217% increase over five years.
Source: “Table 1055. Electronic Shopping and Mail-Order Houses—Total and E-Commerce Sales by Merchandise Line,” Statistical Abstract of the United States: 2011, U.S. Census Bureau, page 663, available online here in a spreadsheet format, and here as a PDF file.
One word of clarification to help prevent any confusion about just what is being presented here. The data in the source table are provided in two columns per year, the first one called “Total,” and the second is “E-Commerce”. The column headed “Total” refers to the total sales for the industry “Electronic Shopping and Mail-Order Houses,” [NAICS 4541], and the second column is the e-commerce portion of that industry’s total. Do not confuse the “Total” column for a measure of total sales of the product line listed in that row. It is, rather, the total sales of that product line made electronically and through mail-order houses.
Original source: U.S. Department of Commerce, Bureau of the Census.