Brain Health Supplements

Geographic reference: World
Year: 2020 and 2028
Market size: $7.21 billion and $13.38 billion, respectively

AARP’s 2019 Brain Health and Dietary Supplements Survey found that more than 25% of Americans aged 50 and over regularly take brain health supplements. As the population ages, the incidence of Alzheimer’s disease and other forms of dementia increases. As of 2020, about 5.8 million people in the United States had Alzheimer’s; 50 million worldwide had some form of dementia.1 The World Health Organization (WHO) estimates that there are 10 million new cases of dementia yearly — one case diagnosed every 3 seconds worldwide. The fear of loss of brain function due to aging is contributing to the adoption of brain health supplements among older adults.

The increasing awareness of mental health issues among adolescents and millennials is fueling the demand for brain health supplements among these age groups. These consumers seek treatment for depression, stress, and anxiety, all common conditions among younger people. The COVID-19 pandemic increased the occurrence of these conditions and in turn increased the demand for brain health supplements to treat them. 

Overall, by application, memory enhancement garnered the largest revenue share in 2020, more than 25%. This was followed by attention and focus, depression and mood, sleep and recovery, anti-aging and longevity, and stress and anxiety. The depression and mood segment is expected to see the fastest growth through 2028 due to the increasing rate of depression among millennials and the growing awareness of mental health and depression in countries such as India and Indonesia. According to the WHO, more than 264 million people worldwide suffer from depression.

Natural molecules accounted for more than half the market in 2020, likely due to their cost-effectiveness and ready availability. Omega-3 fatty acids, Huperzine-A and Acetyl-L-carnitine, for example, are used to improve focus and to treat depression, stress, and anxiety. Docosahexaenoic acid (DHA), eicosapentaenoic (EPA), and Alpha-linolenic acid (ALA) are three major omega-3 fatty acids used to treat depression and cognitive impairment, including Alzheimer’s disease. 

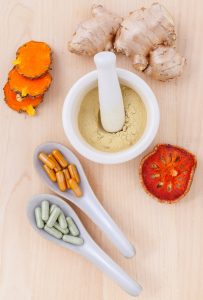
Revenues for herbal extract products are expected to grow at the fastest rate through 2028 as interest in herbal supplements rises in such countries as the United Kingdom and the United States. Demand for ginkgo biloba, ginseng, lion’s mane, curcumin, echinacea, and bacopa monieri has been increasing in recent years. The vitamins and minerals segment has the smallest market share. 

A large number of global and regional manufacturers have a presence in the industry. These companies have been using a combination of new product launches, innovation, mergers and acquisitions, and capacity expansion to increase their shares of the market. Some of the larger manufacturers include Teva Pharmaceutical Industries Ltd., HVMN Inc., Purelife Bioscience Co. Ltd., Peak Nootropics, AlternaScript, Liquid Health Inc., Natural Factors Nutritional Products Ltd., Reckitt Benckiser Group PLC, Onnit Labs Inc., and Quincy Bioscience. Leading brands include The Genius Brand, Bulletproof, Onnit Labs, Vital Vitamins, Prevagen, and Neuriva. Of the 348 brands sold on Amazon, only 18 brands garnered above a 1% share in 2020. The top 18 brands represented 56% of the market, with the other 330 accounting for the remaining 44%.

1 Figure for the United States is from the Alzheimer’s Association. Worldwide figure is from the World Health Organization.

Sources: “Global Brain Health Supplements Market Size, Share & Trends Analysis Report by Product (Natural Molecules, Herbal Extract), by Application (Memory Enhancement, Depression & Mood), by Region, and Segment Forecasts, 2021-2028,” Research and Markets Report Description, January 2021 available online here; “Brain Health Supplements Market Size, Share & Trends Analysis Report by Product (Natural Molecules, Herbal Extract), by Application (Memory Enhancement, Depression & Mood), by Region, and Segment Forecasts, 2021 – 2028,” Grand View Research Report Overview, January 2021 available online here; “Global Brain Health Supplements Market Size, Share & Trends Analysis Report 2021 – ResearchAndMarkets.com,” Business Wire, September 9, 2021 available online here; Sinan Atac, “Nootropic Supplement Sales on Amazon,” Natural Products Insider, April 2021, pp. 39-40 available online here.
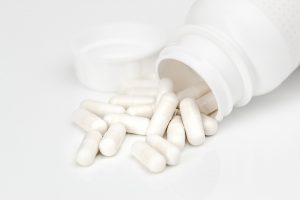
Image source: formulateHealth, “Health_Supplements_-_Nutraceuticals_-_50191152323.jpg,” Wikimedia Commons, CC BY 2.0, July 30, 2020 available online here.

CBD Pet Products

Dog being given a CBD pet product - CBD oil
A dog being given CBD oil. CBD oil is usually given to pets to relieve joint pain. Increasingly it is given to treat anxiety and stress-related disorders. Joint pain can be a consequence of obesity. October 14, 2020, is National Pet Obesity Awareness Day. Click the picture to be taken to the Association for Pet Obesity Prevention website for more information.
Geographic reference: World
Year: 2019 and 2027
Market size: $27.7 million and $399.2 million, respectively

Today’s market size shows the global revenues for CBD-infused pet products in 2019 and projected for 2027.1 The CBD pet product market is a minuscule segment in the overall $4.6 billion CBD product market,2 however, the compound annual growth rate (CAGR) is expected to be nearly double that of the overall market, 40.3% vs. 22.2% in the near future.3 Growth in this industry is unsurprising. According to a Gallup poll, 64% of people in the United States alone are familiar with CBD and/or CBD products. In 2019, Consumer Reports announced that 64 million Americans had tried CBD products between 2017 and 2019, with 22% saying it helped them supplement or replace over-the-counter or prescription drugs. Twenty-four percent of pet owners consume CBD products either for themselves or for their pets.

As more CBD products become available, more people are expected to try these products. And, for those that are helped by them, they may be more inclined to try CBD products on their pets. Even those that have not tried CBD themselves, but have heard the health claims, may consider it for their pets’ health, especially those looking for natural and organic remedies.

CBD is legal in most countries around the world, however, some countries where it’s legal impose regulations about who can grow, produce, or purchase it. In the United States, President Donald Trump signed the Agriculture Improvement Act of 2018, commonly called the Farm Bill. This bill made hemp and hemp products legal by modifying the Controlled Substance Act to exclude hemp from the definition of marijuana and excludes the THC in hemp from being classified as a Schedule I controlled substance, as long as the THC content does not exceed 0.3 percent.

The U.S. Food and Drug Administration (FDA) has the authority to regulate cannabis and cannabis-derived compounds, including hemp-derived CBD under the Federal Food, Drug, and Cosmetics Act. Marketing CBD products promoting use in the “diagnosis, cure, mitigation, treatment or prevention of diseases” without first getting FDA approval and selling unapproved products with unsubstantiated health claims violate this Act.4 To date, only one CBD product has been approved by the FDA, a prescription drug used to treat two rare forms of epilepsy in humans.

In 2019, there were more than 4 dozen types of products containing CBD on the market, with three — oil/tincture, treats/chews, and topicals — geared toward pets. The pet food-grade segment of the market accounted for the largest market share, more than 60%, as pet parents spend more on products for their pets’ health. The therapeutic grade segment of the market is expected to see significant growth through 2027 as CBD oils become increasingly popular to treat inflammation and pain. According to the Association for Pet Obesity Prevention, about 56% of dogs and 60% of cats in the United States are overweight or obese.4 As with humans, obesity in pets can lead to joint pain. As pets age, joint pain from arthritis becomes a concern. The American Pet Products Association reports that 25% of dogs in the U.S. suffer from arthritis. In 2019, the treatment of joint pain disorders claimed a 23.6% revenue share with CBD oil driving this segment of the market. Revenues from CBD products used to treat anxiety and stress-related disorders in pets is expected to grow the fastest through 2027. In a survey conducted by the cannabis market research firm Brightfield Group, more than 60% of human CBD users have taken it for anxiety.

The easy online availability of CBD products without a prescription led to a more than 40% share for the e-commerce segment in 2019. Discounted prices and increasing use of smartphones and the internet in developing countries are expected to contribute to e-commerce growth. Pet specialty stores held the second-highest revenue share. North America accounted for more than 35% of global revenues. The passage of the Farm Bill as well as several major manufacturers located in the region contribute to growth there. In addition, according to a survey conducted by the American Pet Products Association, 34% of cat owners and 39% of dog owners prefer CBD-infused pet products. Europe also held a significant market share in 2019 as CBD is legal in most countries in the region, and both the pet population and people’s expenditures on their pets have been increasing. The Asia-Pacific region is expected to experience significant growth through 2027 due to a growing pet population, higher disposable income, and an unregulated market.

Leading companies include Honest Paws, Canna-Pet, Fomo Bones, Pet Relief, HolistaPet, Joy Organics, Wet Noses, CBD Living, Pet stock, Petco, and Charlotte’s Web. While CBD pet products exist in legal limbo in the United States, products from Honest Paws and Charlotte’s Web have earned the National Animal Supplement Council (NASC) Quality Seal. NASC is an independent agency that performs facility audits on companies that manufacture veterinary supplements. To obtain permission to display the Quality Seal on their products, companies must pass an independent facility audit every two years and demonstrate ongoing compliance with a set of guidelines, two of which include: “having an adverse event reporting/complaint system in place to monitor and evaluate products in real time” and “submitting to random product testing by an independent lab to ensure ingredients meet label claim.”6

To capitalize on the growing popularity of CBD pet products large companies such as Nestlé, Mars Inc., and General Mills plan to enter the market in the near future either with new product launches, by acquiring companies that currently manufacture CBD products, or with collaboration. In February 2019, Martha Stewart collaborated with Canopy Growth Corp., a Canadian cannabis research, product development, and production company, to develop a line of CBD infused animal health products.

1 CBD stands for cannabidiol, the nonpsycoactive ingredient in hemp and marijuana. THC stands for tetrahyrocannabinols. It’s the psychoactive ingredient in these plants.
2 Data for 2018.
3 Revenue for CBD pet products is expected to grow at a compound annual growth rate (CAGR) of 40.3% from 2020 to 2027. Revenue for CBD products overall is expected to grow at a CAGR of 22.2% from 2019 to 2025.
4 Source: Harold B. Hilborn, “2018 Farm Bill Legalizes Hemp, but Obstacles to Sale of CBD Products Remain,” The National Law Review, March 5, 2019 available online here.
5 October 14, 2020 is National Pet Obesity Awareness Day
6 Source: “The NASC Quality Seal,” National Animal Supplement Council available online here.

Sources: “CBD Pet Market Size, Share & Trends Analysis Report by Product (Therapeutic Grade, Food Grade), by Application (Joint Pain, Anxiety), by End-use, by Region (North America, Europe, APAC, Latin America, MEA), and Segment Forecasts, 2020 – 2027,” Grand View Research Report Summary, August 2020 available online here; “CBD Pet Market Size Worth $399.2 Million by 2027 | CAGR: 40.3%: Grand View Research, Inc.,” CISION PR Newswire, September 16, 2020 available online here; “Cannabidiol Market Size, Share & Trends Analysis Report by Source Type (Hemp, Marijuana), by Distribution Channel (B2B, B2C), by End Use, by Region, and Segment Forecasts, 2019 – 2025,” Grand View Research Report Summary, December 2019 available online here; Harold B. Hilborn, “2018 Farm Bill Legalizes Hemp, but Obstacles to Sale of CBD Products Remain,” The National Law Review, March 5, 2019 available online here; Dawn MacKeen, “What are the Benefits of CBD?” The New York Times, October 16, 2019 available online here; “The NASC Quality Seal,” National Animal Supplement Council available online here; “CBD Products are Everywhere But Do They Work?” Harvard Women’s Health Watch, August 2019 available online here; “CBD Statistics 2020,” The Checkup, May 13, 2020 available online here; “52 CBD Products on the Market in 2019,” Ministry of Hemp, September 30, 2019 available online here.
Image source: RR_Medicinals, “dog-husky-cbd-oil-cbd-hemp-oil-4432830,” Pixabay, August 27, 2019 available online here.

Enzymes

enzymes in laundry detergent
Laundry detergent. Enzymes in laundry detergent allow clothes to be washed in cold water.
Geographic reference: World
Year: 2019 and 2027
Market size: $9.9 billion and $17.2 billion, respectively
Sources: “Enzymes Market Size, Share & Trends Analysis Report by Application (Industrial Enzymes, Specialty Enzymes), by Product (Carbohydrase, Proteases, Lipases), by Source, by Region, and Segment Forecasts, 2020 – 2027,” Grand View Research Report Summary, March 2020 available online here; “Enzymes Market Size Worth $17.2 Billion by 2027 | CAGR 7.1%: Grand View Research, Inc.,” CISION PR Newswire, March 16, 2020 available online here; Sindhu Raveendran, et. al., “Applications of Microbial Enzymes in Food Industry,” Food Technology & Biotechnology, March 2018 available online at the U.S. National Library of Medicine, National Institutes of Health here; JanMaarten van Dijl and Michael Hecker, “Bacillus Subtilis: From Soil Bacterium to Super-secreting Cell Factory,” Microbial Cell Factories, January 14, 2013 available online here; “A Global Fermentation Approach,” Leaf by Lesaffre available online here; “Specialty Enzymes Market Worth $6.6 Billion by 2025,” MarketsandMarkets Press Release, April 20, 2020 available online here.
Image source: habelfrank, “washing-powder-detergent-1500058,” PIxabay, July 7, 2016 available online here.

Enzymes are proteins that act as catalysts. Enzymes in the body run cellular processes and convert food to energy and to building blocks for proteins, lipids, nucleic acids, and some carbohydrates. Industrial enzymes such as proteases, amylases, lipases, and others are used in various applications: in the food and beverage industry, in detergents, animal feed, biofuels, textiles, pulp and paper, nutraceuticals, personal care products and cosmetics, wastewater treatment, and medications. In 2018, 60% of industrial enzymes on the market were proteases. In Europe, 900 tons of protease enzymes are used for detergents alone every year.

Today’s market size shows the global enzyme revenues for 2019 and projected for 2027. Microorganism-based enzymes comprised the vast majority of the industrial enzyme market in 2019, about 85%, followed by animal-based and plant-based enzymes. Microorganisms are preferred as a source due to their more predictable and controllable enzyme content. This type of enzyme can also be produced in a cost-effective manner with less space and time necessary than animal-based or plant-based enzymes. There are three types of microorganism-based enzymes: bacterial, fungal, and yeast. Bacterial enzymes are mostly sourced from Bacillus. They’re used in food and detergent and in pharmaceutical applications to diagnose diseases, promote wound healing, and kill disease-causing microorganisms. Fungal enzymes are used in the preparation and production of soy sauce, beer, baked goods, processed fruits, and dairy products. Yeast is used in beer, baked goods, and industrial ethanol production.

Increased investment in biotechnology research for the development of specialty enzymes for medicinal and diagnostic purposes is one of the main factors driving product demand globally. Increasing demand from the food and beverage, biofuel, animal feed, and home cleaning sectors along with the growing consumption of functional foods will contribute to the growth in the market through 2027. By region, growing biofuel production in North America and Europe, as well as increasing meat production in Europe and the Russian Federation, are expected to contribute to growth in these regions. Enzymes are used extensively in meat processing to improve the tenderness of the meat. Europe was third behind China and North America in meat production in 2018. The top three companies in this industry—Novozymes, DuPont Danisco, and DSM— claimed more than 75% of the market in 2019.1 Other major companies in this industry include BASF SE, Associated British Foods PLC, Chr. Hansen Holding A/S, and Advanced Enzyme Technologies.

1 Source: Grand View Research. The press release from CISION PR Newswire mentioning the same Grand View Research report states that the top 3 companies are Novozymes, DuPont Danisco, and BASF SE.

E-Pharmacies

e-pharmacies
E-pharmacies, also known as online pharmacies or mail-order pharmacies, are pharmacies that conduct business over the internet through a website or secure web portal. They send orders of both prescription and non-prescription drugs to customers via the mail or through shipping companies. In 2018, the majority of revenues at e-pharmacies came from over-the-counter medications.

In the United States, legitimate e-pharmacies require a valid prescription from a doctor or other health care professional before dispensing prescription drugs. They are licensed by the appropriate state agency and have a licensed pharmacist available to answer questions. They must also provide a street address. In many cases, e-pharmacy services are part of a person’s health insurance benefits. For example, OptumRx, Express Scripts, and CVS Caremark are affiliated with the UnitedHealth Group, Cigna, and Aetna health insurance companies, respectively.

Because prescription drug prices are high, some people turn to illegal pharmacies. Illegal pharmacies may send an unsolicited email offering medicine at a deep discount. These pharmacies are not licensed and allow people to buy prescription medication without a valid prescription from a health care provider. Buying pharmaceuticals from these types of businesses is risky. The medicines ordered may have too much or too little of the active ingredient, not contain the right active ingredient or contain harmful ingredients. An estimated 10% of medications available worldwide are counterfeit. In India and developing countries in Africa, Asia, and Latin America more than 30% are.

The European Medicines Agency is currently warning consumers to avoid online pharmacies that falsely claim that a product they sell can treat or prevent COVID-19. The U.S. Food and Drug Administration (FDA) and the Federal Trade Commission issued warnings to 7 companies and shut down dozens that claimed their products do the same. Currently, there are no approved medications to treat or prevent COVID-19 and there are no vaccines available.

Today’s market size shows worldwide e-pharmacy revenues for 2018 and projected for 2025.1 In 2018, 11% of adult pharmacy customers obtained their prescriptions from e-pharmacies. Since the outbreak of the COVID-19 pandemic, some online pharmacies have been seeing a surge in orders as people decide to avoid public places such as brick-and-mortar pharmacies and instead order their medications online. Whether these new e-pharmacy consumers will continue to order their medication in this way once the pandemic is over and life returns to normal is yet to be seen.

North America is the largest market for e-pharmacies and is expected to continue to be through 2025 due to the growing number of internet users coupled with their familiarity with using online services. A growing awareness of e-pharmacies, especially ones affiliated with large companies, as well as government campaigns meant to educate consumers about how to spot illegal e-pharmacies are also expected to contribute to North America’s domination of the market. Leading global e-pharmacy companies include The Kroger Co., The Walgreen Co., Express Scripts Holding, CVS Health, Doc Morris, Giant Eagle, Wal-Mart Stores, OptumRx, 1mg, and Netmeds.

1 Revenues are for legal businesses only.

Geographic reference: World
Year: 2018 and 2025
Market size: $42.32 billion and $107.53 billion, respectively
Sources: “Global Share of E-Pharmacy Market Size to Surpass USD 107.53 Billion by 2025,” Zion Market Research Press Release, July 26, 2019 available online here; “Online Pharmacy,” Wikipedia, March 7, 2020 available online here; “How to Buy Medicines Safely From an Online Pharmacy,” U.S. Food and Drug Administration, January 25, 2018 available online here; Hannah Balfour, “EMA Warns Consumers About Falsified COVID-19 Drugs from Online Pharmacies,” European Pharmaceutical Review, March 31, 2020 available online here; Hannah Balfour, “FDA and FTC Issue Warning Letters to Companies Selling Fraudulent COVID-19 Products,” European Pharmaceutical Review, March 10, 2019 available online here; András Fittler, PharmD, PhD, et. al., “Consumers Turning to the Internet Pharmacy Market: Cross-Sectional Study on the Frequency and Attitudes of Hungarian Patients Purchasing Medications Online,” Journal of Medical Internet Research, August 22, 2018 available online here; Matt Baron, “COVID-19 Sparks Surge in U.S. Online Pharmacy Purchases,” Patch, April 3, 2020 available online here.
Image source: National Cancer Institute, “A Male Pharmacist is Examining a Drug from the Pharmacy Inventory,” Unsplash, January 29, 2020 available online here.

Opioid Use Disorder Medications

opioid use disorder drugs

Before the world was dealing with the COVID-19 pandemic, another public health emergency was on the minds of everyone: the opioid abuse crisis. Opioid use disorder (OUD) is a chronic condition characterized by a compulsive, prolonged, repeated self-administration of opioids. Patients can be addicted to either prescription opioids such as hydrocodone, oxycodone, morphine, codeine, and fentanyl or non-medical opioids such as heroin. Prescription opioids are mostly used to treat moderate to severe pain, with some types also used to treat cough and diarrhea. In addition to relieving the medical conditions for which they were prescribed, they make a person feel very relaxed and euphoric which is why they’re also used for non-medical purposes.

Today’s market size shows the global revenues for drugs used in the treatment of OUD in 2018 and projected for 2026. Worldwide more than 53 million people aged 15-64, or 1.1% of that population, abused opioids in 2019. Sixty-six percent of global drug overdose deaths associated with drug use disorders were related to opioids. In the United States in 2018, 2.9 million people aged 15 and older suffered from OUD. According to the U.S. Centers for Disease Control, 130 people in the United States die from an opioid overdose every day. In 2017, 9% of overdose deaths linked to opioids occurred in people under the age of 25.  The United States declared the opioid abuse crisis a public health emergency on October 27, 2017. 

Treatment for OUD involves Medication-Assisted Treatment (MAT) with an opioid agonist or opioid antagonist in order to mitigate the cravings and the withdrawal symptoms that come from detoxification without producing the euphoria that the abused drug caused. MAT also includes behavioral therapy and counseling. Opioid agonists activate the same opioid receptors that drugs such as heroin and opioid pain medications do but they do so more slowly or less strongly than other opioids so they do not produce euphoria in those being treated for OUD. Methadone and buprenorphine are two types of opioid agonists. Opioid antagonists such as naltrexone block the activation of opioid receptors in the brain. They prevent any opioid drug from producing euphoria. Naltrexone has been limited as an ongoing treatment for opioid use disorder due to the drug not being tolerated by patients and patients not taking the medication as prescribed. In 2010 an injectable, long-acting form of naltrexone was approved by the U.S. Food and Drug Administration for use in the treatment of OUD. This form of the drug is preferable for people who don’t have ready access to healthcare or for those who find it difficult to take medications regularly. 

Globally, in 2018, more than half of the revenues from OUD drug treatment came from buprenorphine, followed by methadone and naltrexone. In the United States, buprenorphine also had the highest market share followed by methadone and naltrexone, although naltrexone’s share is predicted to surpass methadone by 2026. Buprenorphine was the first medication eligible to be prescribed by certified doctors through the Drug Addiction Treatment Act of 2000. This eliminated the need for patients to visit specialized treatment clinics thereby increasing access to treatment. The Comprehensive Addiction and Recovery Act, signed into law in 2016, expanded eligibility to prescribe buprenorphine-based drugs as part of MAT to qualifying nurse practitioners and physician assistants through October 1, 2021.

In 2018, the North American market generated the highest revenues and is expected to do the same through 2026 due to the opioid epidemic in the United States and Canada. Also, newer forms of medication to treat OUD are expected to come on the market in the United States during this time period. Several pharmaceutical manufacturers are leaders in this industry including Indivior, Alkermes, Titan Pharmaceuticals, Hikma Pharmaceuticals, Teva Pharmaceuticals, MediciNova, Orexo, Camurus, and Omeros. To increase market share companies are focusing on mergers and acquisitions in addition to launching their products in different regions of the world.

Geographic reference: World
Year: 2018 and 2026
Market size: $1.9 billion and $4.5 billion, respectively
Sources: “Opioid Use Disorder Market Size, Share & Trends Analysis Report by Drug (Buprenorphine, Methadone, Naltrexone), Competitive Landscape, and Segment Forecasts, 2019 – 2026,” Grand View Research Report Summary, July 2019 available online here; “Opioid Use Disorder Market Worth $4.5 Billion By 2026 | CAGR 10.1%,” Grand View Research Press Release, July 2019 available online here; Report of the International Narcotics Control Board for 2019, International Narcotics Control Board, January 2020 available online here; Andrew Saxon, MD, “Opioid Use Disorder,” American Psychiatric Association, November 2018 available online here; University of Southern California. “Teens Abusing Painkillers are More Likely to Later Use Heroin,” ScienceDaily, July 8, 2019 available online here; “Prescription Opioids,” Drug Facts, National Institute on Drug Abuse, July 2019 available online here; “Medications to Treat Opioid Use Disorder,” National Institute on Drug Abuse, June 2018 available online here.
Image source: Hal Gatewood, “Meds,” Unsplash, November 15, 2019 available online here.

Smart Pills

We have smartphones, smart speakers and even smart homes. Why not smart pills?

Those of us of a certain age remember the Jetsons Peek-a-Boo Prober Capsules. A form of this went from science fiction to reality in 2014 when the U.S. Food and Drug Administration (FDA) approved the PillCam. It’s a pill-sized camera that the patient swallows. It makes its way through the digestive system in about 8 hours taking pictures. The data is then sent to a receiver the patient wears around his or her waist. Later, a doctor can review the results. This type of pill is meant to be an alternative to a colonoscopy or endoscopy.

Another type of smart pill has an indigestible sensor built into the pill that monitors when a patient takes a dose. The sensor is activated when it comes in contact with stomach fluid. It sends a message to a wearable patch which in turn sends a message to an app on a patient’s smartphone. If the patient allows, the information can be sent to the patient’s doctor. Smart pills of this sort are created with the purpose of making it easier for patients to remember to take their medications and to let doctors know if their patients are complying.

In the United States, up to 50% of people do not take their medication as prescribed. In developing countries, adherence is even less. Medication nonadherence can account for up to 50% of treatment failures. According to the Office of the United States Inspector General, 125,000 deaths from cardiovascular diseases such as heart attack and stroke are caused by nonadherence to long-term drug therapies. Also, up to 23% of admissions to nursing homes, 10% of hospital admissions and many doctors’ visits, diagnostic tests and treatments are due to nonadherence. An estimated $100 to $300 billion in healthcare costs can be saved annually if medication adherence rates were higher. “Adherence rates of 80% or more are needed for optimal therapeutic efficacy.”1

In November 2017 the FDA approved the first drug with a digital ingestion tracking system, Abilify MyCite, a medication used to treat bipolar disorder and schizophrenia. Those who have schizophrenia have one of the highest medication noncompliance rates on average. However, some argue that suggesting people with schizophrenia swallow a digital pill that will send signals outside their body will only worsen their condition, especially for those who already experience paranoia or persistent feelings about being watched or persecuted. Others like Mitchell Mathis, M.D., director of the Division of Psychiatry Products in the FDA’s Center for Drug Evaluation and Research state: “Being able to track ingestion of medications prescribed for mental illness may be useful for some patients.” Regardless, according to the FDA, “Abilify MyCite’s prescribing information notes that the ability of the product to improve patient compliance with their treatment regimen has not been shown. Abilify MyCite should not be used to track drug ingestion in ‘real-time’ or during an emergency because detection may be delayed or may not occur.” Abilify MyCite retails for, in some cases, twice the amount of the generic, non-digital equivalent.

Since the advent of this drug, smart pills have been designed for conditions such as uncontrolled hypertension, type-2 diabetes, and more recently cancer. According to a research study by Proteus Digital Health, the manufacturer of the drugs, those taking smart pills for uncontrolled hypertension and type 2 diabetes had better results when compared to people taking standard therapies.

Today’s market size shows the global smart pill revenue figures for 2016, 2018 and projected for 2025. As of 2016, more than 75% of smart pill revenue came from capsule endoscopy versus less than 25% for drug delivery. North America led the world in the share of smart pill revenue with 57.1%. North America is expected to continue its lead into the future due to technological advances in the healthcare sector, increases in the incidence of colorectal cancer and regulatory approval of new products. Major companies include Medtronic PLC; Proteus Digital Health; CapsoVision, Inc.; Olympus Corporation; and Medisafe. In December 2019, etectRx received FDA approval for its ID-Capsule system to compete with Proteus’s system. etectRx’s system has a lanyard rather than a wearable patch.

1 Source: Jennifer Kim, et. al., “Medication Adherence: The Elephant in the Room,” U.S. Pharmacist, January 19, 2018 available online here

Geographic reference: World
Year: 2016, 2018 and 2025
Market size: $779.4 million, $850 million and $1.5 billion, respectively
Sources: “Smart Pills Market Analysis by Application (Products [Capsule Endoscopy, Drug Delivery], Tools, and Patient Monitoring Software), by Region (North America, Europe, Asia Pacific, Latin America, and Middle East & Africa), and Segment Forecasts, 2018 – 2025,” Grand View Research Report Summary, December 2017 available online here; “Smart Pills Market by Component (Smart Pills and Workstations), by Application (Imaging and Monitoring), and by End-User (Hospitals, Clinics, Research Institutes, and Home Healthcare): Global Industry Perspective, Comprehensive Analysis, and Forecast, 2018–2025,” Zion Market Research, June 7, 2019 available online here; Matt Novak, “George Jetson Gets a Check-Up,” Smithsonian Magazine, January 2, 2013 available online here; “The FDA Approved a PillCam the Jetsons Predicted 50 Years Ago,” Paleofuture, February 7, 2014 available online here; Adherence to Long-Term Therapies, World Health Organization, 2003 available online here; Jennifer Kim, et. al., “Medication Adherence: The Elephant in the Room,” U.S. Pharmacist, January 19, 2018 available online here; Michael Rucker, “Digital Pills are Coming to Health Care,” Verywell Health, December 6, 2019 available online here; “FDA Approves Pill with Sensor That Digitally Tracks If Patients Have Ingested Their Medication,” FDA News Release, November 13, 2017 available online here; Erin Brodwin, “A Silicon Valley Company Just Launched ‘Smart’ Cancer Pills That Track You With Tiny Sensors Stamped Into Your Medication,” Business Insider, January 19, 2019 available online here; Sam Draper, “How Smart Pills Could Revolutionize Healthcare,” Wearable Technologies, May 23, 2018 available online here; Elise Reuter, “New ‘Smart Pill’ Maker Gains FDA Approval,” MedCity News, December 9, 2019 available online here; Richard Staines, “FDA Approves etectRx ‘digital pill’ as Rivals Struggle,” Pharmaphorum, December 10, 2019 available online here; “Abilify,” GoodRx available online here; Christina Farr, “Digital Health Start-Up Once Worth $1.5 Billion is Racing to Keep Lights on as Investors Flee,” CNBC, December 8, 2019 available online here.
Image source: Steve Buissinne, “medicine-pills-prescription-4097308,” PIxabay, April 2, 2019 available online here. Picture does not show smart pills. Image is used for illustration purposes only. See the picture in the MedCity News source for a picture of one type of smart pill.

Digestive Health Supplements

Digestive health supplements

Soft drinks, potato chips, candy, fast food. Tasty, yes. But also high in fat, added sugar and salt. Some researchers believe that a diet high in these types of food, along with a diet of highly processed foods, can be a factor in the development of digestive disorders. Other top factors include smoking, pollution, and genetics.

As consumers become aware that gut health contributes to overall health, demand for digestive health supplements is predicted to increase. Probiotics, prebiotics, enzymes, and fulvic acid are some types of digestive health supplements. Probiotics, prebiotics, and enzymes can also be found in some types of food, food which also contains many beneficial nutrients.

Probiotics are live bacteria and yeasts that are beneficial for the digestive system. They are found in foods such as yogurt,1 kefir, unpasteurized sauerkraut, and kimchi. Probiotic supplements are used to treat antibiotic-associated diarrhea in adults and infectious diarrhea in infants and children. They are also given to people with Crohn’s disease, ulcerative colitis, and irritable bowel syndrome to help them maintain remission of their disease. Supplements contain various strains of probiotics, depending on the brand. Some popular brands of over-the-counter probiotic supplements that have been tested for use with gastrointestinal disorders include Align (Bifidobacterium infantis 35624), Culturelle (L. rhamnosus GG), and Florastor (Saccharomyces Boulardii).2 

Prebiotics are a type of plant-based fiber that the human body cannot digest. Prebiotics provide food for probiotics; together they maintain a healthy colony of bacteria and microorganisms in a person’s gastrointestinal tract. Prebiotics can be found in fruits, vegetables, and whole grains. Apples, garlic, onions, asparagus, barley, and oats are some foods that contain prebiotics. Most people get enough prebiotics in their diet if they eat a variety of fruits, vegetables, whole grains, and fermented foods, but for those that don’t, prebiotic supplements may be beneficial. Some popular brands of prebiotic supplements include Benefiber, Metamucil, and Fiber Choice.

Digestive enzymes break down food so that a person can absorb its nutrients. A majority of digestive enzymes are manufactured in the pancreas. Lipase breaks down fats. Amylase breaks down carbohydrates. Proteases and peptidases break down proteins. Doctors prescribe digestive enzyme supplements to people with cystic fibrosis, chronic pancreatitis, and pancreatic cancer. These conditions cause a person’s digestive enzyme levels to be low. Over-the-counter digestive enzyme supplements include lactase supplements to break down lactose, the sugar in dairy products, and alpha-galactosidase supplements, to break down the complex carbohydrates in foods such as beans, broccoli, cabbage, and cauliflower. Lactaid and Beano are two popular brands of these types of digestive enzymes, respectively.

Fulvic acid has been used in traditional Indian medicine for 3,000 years. Shilajit, a tar-like substance found in the Himalayas, Caucasus mountains, Altai Mountains and the mountains of Gilgit Baltistan, is created from the decomposition of plants. It contains soil-based organisms and is composed of 15-20% fulvic acid. Some believe that ingesting fulvic acid supplements such as shilajit can improve a person’s gut flora to treat such conditions as small intestinal bacterial overgrowth, irritable bowel syndrome, leaky gut, chronic constipation, and diarrhea. It’s believed that poor gut health caused by oxidative stress leads to chronic inflammatory diseases. As an antioxidant, fulvic acid is thought to counteract the oxidative stress.

Today’s market size shows the total global revenue for digestive health supplements in 2018 and projected for 2025. In Japan, the incidence of ulcerative colitis alone increased from 8 cases per 100,000 people in 1985 to 64 cases per 100,000 in 2005. In the United States, 60-70 million people are afflicted with digestive diseases according to the National Institute of Diabetes and Digestive and Kidney Diseases. The growing prevalence of digestive disorders in Japan, the United States, and several European countries has contributed to the increased demand for digestive health supplements. This is projected to continue through 2025. In the United States, probiotics constitute an overwhelming share of the digestive health supplement market. Currently three-quarters of the supplements sold are in the form of tablets and capsules, however; powdered supplements are expected to gain in popularity in the coming years due to consumer interest in organic ingredients and the convenience of being able to add powdered supplements to the foods they eat. Also, powdered supplements can be absorbed by the body faster. Nearly a third of the supplements sold worldwide in 2018 were manufactured in Italy, Japan, and the United States. Top manufacturers of digestive health supplements include Bayer AG, Amway, Nature’s Bounty Co., and NOW Foods, among others.

1 Manufacturers of some brands of yogurt add additional probiotics to their product. Two such brands are Activia and Danactive.
2 Any mention of brands in this post does not constitute an endorsement. The strain of probiotic in the product is included within the parentheses.

Geographic reference: World
Year: 2018 and 2025
Market size: $8.67 billion and $15.67 billion, respectively
Sources: “Digestive Health Supplements Market Size, Share & Trends Analysis Report by Product (Prebiotics, Probiotics, Enzymes), by Form, by Distribution Channel (OTC, Prescribed), by Region, and Segment Forecasts, 2019 – 2025,” Grand View Research Report Summary, October 2019 available online here; “Digestive Health Supplements Market Size Worth $15.67 Billion by 2025: Grand View Research, Inc.,” CISION PR Newswire, October 23, 2019 available online here; Ames Gross, “Gastrointestinal Diseases Rise in Asia,” MedTech Intelligence, January 22, 2016 available online here; Hrefina Palsdottir, “11 Probiotic Foods That Are Super Healthy,” Healthline, August 28, 2018 available online here; Matthew A. Ciorba, “A Gastroenterologist’s Guide to Probiotics,” Clinical Gastroenterology and Hepatology, U.S. National Library of Medicine, National Institutes of Health, September 2012 available online here; Arlene Semeco, “The 19 Best Prebiotic Foods You Should Eat,” Healthline, June 8, 2016 available online here; “Gut Reaction: A Limited Role for Digestive Enzyme Supplements,” Harvard Health Letter, Harvard Health Publishing, Harvard Medical School, March 2018 available online here; Zawn Villines, “What is the Difference Between Prebiotics and Probiotics?” Medical News Today, October 29, 2018 available online here; Joanne Slavin, “Dietary Fiber: The Prebiotic Connection,” Clinical Advisor, April 20, 2015 available online here; Angela Stringfellow, “The Best Fiber Supplements (2019 Reviews),” Family Living Today, January 9, 2019 available online here; Janet Renee, “About the Enzyme Alpha Galactosidase,” Livestrong.com available online here; “Should You Take Probiotics?” Harvard Health Letter, Harvard Health Publishing, Harvard Medical School, April 2015 available online here; John Winkler and Sanjoy Ghosh, “Therapeutic Potential of Fulvic Acid in Chronic Inflammatory Diseases and Diabetes,” Journal of Diabetes Research, U.S. National Library of Medicine, National Institutes of Health, September 10, 2018 available online here; “Digestive Diseases Statistics for the United States,” National Institute of Diabetes and Digestive and Kidney Diseases, November 2014 available online here; “Shilajit,” Wikipedia, November 6, 2019 available online here.
Image source: Efraimstochter, “dietary-supplements-pills-3512184,” Pixabay, July 3, 2018 available online here.

Irritable Bowel Syndrome Treatments

irritable bowel syndrome treatments

Irritable bowel syndrome (IBS) is a chronic disease that affects the large intestine. People with this disease experience cramping, abdominal pain, bloating, gas and diarrhea or constipation, or alternating bouts of diarrhea and constipation. Unlike inflammatory bowel diseases such as ulcerative colitis or Crohn’s disease, IBS does not cause changes in bowel tissue, and sufferers are not at increased risk of contracting colon cancer.

Currently, a precise cause for this disease is not known, but it may be due to be a faulty interaction between the brain, the nervous system, and the gut. An overactive immune system may also be to blame in those sufferers who have increased numbers of immune-system cells in their intestines or those whose IBS developed after a severe bout of gastroenteritis brought on by a bacterial infection or virus.

Globally, 10-15% of the population has this disease, most under the age of 50. Symptoms of IBS can be triggered by stress and certain foods such as wheat, dairy products, cruciferous vegetables, and carbonated drinks. More women than men have IBS; in the United States, 2 out of 3 patients are women. Many women with this disease report worsening of symptoms around the time of their menstrual periods, indicating that hormonal changes may also be a trigger in some people.

In the United States, 25-45 million people suffer from IBS. Because signs and symptoms can indicate many different conditions, doctors have trouble diagnosing this disease. According to a survey by IFFGD,1 a diagnosis of IBS typically takes more than 6 years after the onset of symptoms. Globally, 40% of patients have mild IBS, 35% a moderate form of the disease, and 25% a severe form. While IBS can affect a person’s emotional, physical, social and financial well-being no matter how mild or severe the symptoms, most patients taking prescription medication for their symptoms have moderate to severe IBS.

Today’s market size shows the worldwide irritable bowel syndrome treatment revenues for 2018 and projected for 2026. Growth in the market is expected over this time period due to a growing prevalence of the disease, especially IBS-C,2 and doctors increasingly prescribing medications to treat it. Several new drugs to treat this disease, currently in clinical trials, are expected to come to market in the coming years. Pharmaceutical companies are also expanding their product offerings in several regions of the world. In January 2019, Ironwood Pharmaceuticals and AstraZeneca received approval to market Linzess, a treatment for IBS-C, in China, enabling them to sell their product to potentially tens of millions of more patients. In addition to Linzess, other leading brand-name treatments include Xifaxan, Viberzi, and Amitiza.3 Linzess/Constella4 generated the largest revenue in 2018. Some major manufacturers of IBS treatments include Ironwood Pharmaceuticals, Inc.; Allergan; Astellas Pharma, Inc.; Takeda Pharmaceutical Co. Ltd. AstraZeneca; and Sebela Pharmaceuticals Inc.

1 International Foundation for Functional Gastrointestinal Disorders
2 Constipation-predominant IBS
3 Xifaxan and Viberzi treat IBS-D, diarrhea-predominant IBS. Amitiza treats IBS-C.
4 Linzess is marketed as Constella in Europe.


Geographic reference: World
Year: 2018 and 2026
Market size: $1.5 billion and $3.4 billion, respectively
Sources: “Irritable Bowel Syndrome Treatment Market Size, Share & Analysis Report by Type (IBS-C, IBS-D), by Region, and Segment Forecasts, 2019-2026,” Grand View Research Report Summary, July 2019 available online here; “Irritable Bowel Syndrome Treatment Market Size Worth Around US$ 3.4 Bn by 2026,”Acumen Research and Consulting Press Release, July 16, 2019 available online here; and “Irritable Bowel Syndrome,” Mayo Clinic, March 17, 2018 available online here.
Image source: newsong, “pill-medicine-capsule-illness-pain-3264951,” Pixabay, March 27, 2018 available online here.

Marijuana Drying and Curing Equipment

In the United States, 46 states have decriminalized small amounts of marijuana, allow the use of medical marijuana, or allow the adult use of recreational marijuana. Twenty other countries also allow some form of marijuana use.1 Cultivating and harvesting marijuana plants are only two parts in the process of creating a usable product. The plants also need to be dried and cured.

The drying and curing process, if done properly, enhances the flavor and smell, inhibits mold and bacteria growth, increases the shelf-life of the product, and may increase potency. Drying and curing require precise humidity and temperature, both of which can be influenced by several factors including seasonal temperatures, elevations, barometric pressures, different cultivars, and quantities, to name a few. Some smaller processors that have only a few plants may prefer to dry and cure the product manually, using drying racks and containers for curing, while personally monitoring the environment in the drying room and checking on the progress often. Mid-size and larger processors that dry and cure several pounds of product at a time are more likely to use stand-alone drying and curing machines that automatically maintain the correct temperature and humidity within, thereby needing less oversight.

Today’s market size shows the sales of marijuana drying and curing equipment worldwide in 2017 and projected for 2025. The United States led with a 55% share in revenue in 2017, followed by Canada with 32.2%. Australia, Uruguay, Israel, and Colombia combined composed the other 12.8%. More countries are expected to legalize the use of marijuana for medical or recreational use. As a result of this and technological advances in the equipment, demand is predicted to increase.

1 As of January 2, 2018.

Geographic reference: World
Year: 2017 and 2025
Market size: $76.7 million and $157.1 million, respectively
Sources: “Marijuana Drying and Curing Equipment Market Size, Share & Trends Analysis Report By Country (U.S., Canada, Germany, Australia, Uruguay, Israel, and Colombia), and Segment Forecasts, 2019 – 2025,” Grand View Research Report Summary, January 2019 available online here; “The Global Marijuana Drying and Curing Equipment Market Size is Expected to Reach USD 157.1 Million by 2025,” Cision PR Newswire, February 18, 2019 available online here; “All of the Places in the World Where Pot Is Legal,” Kindland, June 2, 2017, updated January 2, 2018 available online here; Kenneth Morrow, “Master the Art of Drying and Curing Cannabis,” Cannibis Business Times, April 2017 available online here; Nebula Haze and Alltatup, “Complete Drying & Curing Marijuana Guide,” Grow Weed Easy, February 1, 2019 available online here; “Top Tips to Successfully Dry and Cure Your Fresh Cannabis Buds,” Royal Queen Seeds Blog, October 30, 2017 available online here; “The Drying and Curing Process,” Cann Systems available online here.
Image source: gjbmiller, “marijuana-cannabis-weed-bud-green-2174302,” Pixabay, March 27, 2017 available online here.

Hemp

Hemp seeds

Hemp, a variety of the cannabis plant, is a widely cultivated herb grown for its edible seeds, oil, and strong woody fiber used in cordage and fabrics. Unlike marijuana, modern-day hemp contains very small concentrations of the psychoactive substance delta-9-tetrahydrocannabinol (THC), less than 0.3%. Marijuana, on the other hand, typically contains between 5% and 20%, with some types containing up to 35%. Hemp contains higher concentrations of cannabidiol (CBD), however, than marijuana. CBD is the ingredient in cannabis thought to have medicinal properties. The Federal Drug Administration in the United States recently approved the CBD-derived epilepsy drug Epidiolex. Of all the products made from hemp sold in the U.S. in 2017, consumers spent the most on hemp-derived CBD, $190 million. One of the top food trends in 2019 is expected to be CBD-infused food and drinks, increasing demand. Spending on hemp-based industrial products totaled $144 million in 2017, much of which was spent by the automotive industry.

Hemp has been cultivated for thousands of years. Its fibers were found in pottery dating back more than 5,000 years in what is modern-day Taiwan. Textiles made of hemp were used in China as far back as 4000 BC and hemp paper was first used in 100 BC. The first recorded use of cannabis as medicine was in 2737 BC. In the 1500s, hemp was used for sailcloth for the English Navy. Because of this, English farmers and later farmers in the North American colonies were required to devote some acreage to hemp cultivation. The variety of cannabis that was grown in the American colonies was Cannabis sativa, an imported variety, not the indigenous hemp known to Native Americans. The plants were grown in tight clusters, thereby creating a taller plant with fewer branches and fewer female flowers. It’s the female flowers that contain high concentrations of THC. In the 18th-century, hemp was made into clothes, rope, bed ticking and sacks. During the American Revolution, it was in high demand for ropes and sails for the Continental Navy as well as for the state-sponsored fleets. Demand for it waned after the war but remained a flourishing domestic cash crop in the United States. After the Marihuana Tax Act of 19371 was implemented, which also taxed and regulated hemp, the popularity of hemp declined and many businesses shuttered. In the middle of the 20th century, calls for the prohibition of marijuana due to its intoxicating effects led to cannabis being banned in the Federal Comprehensive Drug Abuse Prevention and Control Act of 1970 signed by Richard Nixon. No provision was made to exempt industrialized hemp grown for utilitarian purposes.

As the tide of public opinion toward cannabis turned and more and more states started to legalize medical marijuana, hemp was again looked at as a viable domestic crop. The Agricultural Act of 2014, signed by President Obama, defined industrialized hemp as separate from marijuana and authorized research and pilot programs for the production of hemp in conjunction with universities and state departments of agriculture. In 2015, seven states planted research crops. Twenty-seven states removed barriers to hemp production and Colorado, Oregon, and Vermont licensed farmers to grow hemp under state law. Unfortunately, Federal law still classified hemp as a Schedule I substance so farmers could still go to jail and have their property taken away for growing hemp. This changed with the Agriculture Improvement Act of 2018, also known as the 2018 Farm Bill, that President Trump signed into law in December 2018. This law amended the Controlled Substances Act to exempt the THC in hemp from being classified as a Schedule I drug, opening up opportunities for farmers to grow and sell industrialized hemp in the United States without the worry of losing their property or going to prison due to Federal drug policy.

Today’s market size shows the total sales of hemp products in the United States in 2017 and 2022 according to Hemp Business Journal estimates. *Future estimates vary widely among different groups when it comes to the largest sales category in the hemp industry, CBD-based products. Marijuana research firm Greenwave Advisors predicts that CBD product sales alone will reach $3 billion by 2021. Cannabis industry analysts at the Brightfield Group predict that sales will reach $22 billion by 2022. These higher estimates are bolstered by many factors, not the least of which is the signing of the 2018 Farm Bill into law. Also, products containing CBD are now more widely available, being sold at health food stores and in beauty aisles of mainstream retailers. More doctors are prescribing CBD products for conditions such as post-traumatic stress disorder (PTSD), anxiety, multiple sclerosis, and chronic pain. The Federal Drug Administration’s approval of Epidiolex will also fuel demand. An estimated $591 million was spent on hemp-based CBD products in 2018. Demand is expected to grow as consumers continue to seek natural remedies for ailments.

1 “Under pertinent provisions of the Marihuana Tax Act, 26 U.S.C.S. §§ 4751-4753, every person who sells, deals in, dispenses, or gives away marihuana must register with the Internal Revenue Service and pay a special occupational tax.” Also, a transfer tax was required to be paid and a form was to be filled out with the name and address of the buyer and seller and the amount of marihuana to be purchased. The form was to be filled out in triplicate, one copy going to the Internal Revenue Service, one copy to be kept by the buyer and the original to be kept by the seller. All copies and originals were subject to inspection by federal and state law enforcement. Source: “Marijuana Tax Act Law and Legal Definition,” USLegal available online here.

Geographic reference: United States
Year: 2017 and 2022
Market size: $820 million and $1.9 billion*, respectively
Sources: “The U.S. Hemp Industry Grows to $820mm in Sales in 2017,” Hemp Business Journal, May 20, 2018 available online here; “Hemp,” Merriam-Webster available online here; “The Truth Behind Hemp in the United States,” Ministry of Hemp available online here; Ben Swensen, “Hemp & Flax in Colonial America,” Colonial Williamsburg Journal, Winter 2015 available online here; “10,000- year History of Marijuana Use in the World,” Advanced Holistic Health available online here; Elisabeth Garber-Paul, “Exclusive: New Report Predicts CBD Market Will Hit $22 Billion by 2022,” Rolling Stone, September 11, 2018 available online here; Public Law No: 115-334. Agriculture Improvement Act of 2018 available online here; Daniele Piomelli and Ethan B. Russo, “The Cannabis sativa Versus Cannabis indica Debate: An Interview with Ethan Russo, MD,” Cannabis and Cannabinoid Research, US National Library of Medicine, National Institutes of Health, January 1, 2016 available online here; Brian S. Julin, “Welcome to Frequently Asked Questions About Cannabis Hemp,” 1994 available online here; “Titles II and III of the Comprehensive Drug Abuse Prevention and Control Act of 1970 (Public Law 91-513)” available online here; “Hemp vs Marijuana,” Ministry of Hemp available online here; “Marijuana Tax Act Law and Legal Definition,” USLegal available online here; Trevor Hughes, “It Won’t Get You High, But It Can Make You Full,” USA Today for the Lansing State Journal, January 14, 2019, page 1B.
Image source: ulleo, “hemp-cannabis-seeds-grains-healthy-2258608,” Pixabay, April 28, 2017 available online here.

Halal Nutraceuticals and Vaccines

NutraceuticalsAccording to recent research, more than 60% of the 1.8 billion Muslims around the world consume nutraceuticals in some form daily.1 Nutraceuticals are products that provide health benefits in addition to their nutritional value. They are thought to improve overall health, delay the aging process, prevent chronic diseases and increase life expectancy. They can be in the form of fortified foods and beverages or dietary supplements. In 2016 the global nutraceutical market was valued at nearly $200 billion. Not all nutraceuticals are halal, however.

Halal, translated as “lawful” or “permitted”, is a set of dietary guidelines based on the Qur’an. By definition, halal foods (which include dietary supplements and vaccines) are “free from any component that Muslims are prohibited from consuming according to Islamic law” and “processed, made, produced, manufactured and/or stored using utensils, equipment and/or machinery that have been cleansed according to Islamic law.”2 Many nutraceuticals contain beta-carotene, gelatin, stearates, glycerine, enzymes, emulsifiers and flavors that may be derived from unpermitted, or haram, ingredients such as pork. However, companies can substitute plant, fish or other permissible foods in the manufacture of these ingredients in order to make them halal and permissible for Muslims to consume.

Vaccines have become less popular among Muslims as evidenced by several outbreaks of preventable diseases such as polio, pertussis, and measles in majority Muslim countries in recent years. While some of the hesitancy about vaccines is due to misinformation spread by social media and influential celebrities, a majority of parents who fail to vaccinate their children cite concerns about the vaccines not being halal. Islamic law, however, does recognize that in dire and necessary circumstances, necessity outweighs prohibitions. “The Fatwa Council in Malaysia and internationally have ruled that vaccination is permissible for the purpose of treatment and prevention, and refusing vaccinations will result in greater harm.”3 Before 2018, there were no halal-certified vaccines available globally. The pharmaceutical company AJ Pharma Holding Sdn Bhd is expected to open a facility in Malaysia sometime in 2018 that will create halal vaccines and export them around the world. According to the company, the worldwide halal vaccine market will be worth between $1.3 billion and $1.4 billion by 2020. Overall, the global vaccine market, of which the halal vaccine market is a part, is expected to reach $34.7 billion in 2020, according to Evaluate Pharma.

Today’s market size shows the expected revenues earned from the sales of halal nutraceuticals and vaccines in 2018 and 2023 worldwide. Leading companies in these industries include Abbott Laboratories, AJ Biologics Sdn Bhd, PT Kalbe Farma Tbk, Amway, NoorVitamins, Chemical Company of Malaysia Berhad, Agropur Inc. and Kotra Pharma (M) Sdn Bhd.

1 “Halal Guidelines,” Halal International Certification Pvt Ltd., 2016.
2 “What is Halal? A Guide for Non-Muslims,” Islamic Council of Victoria.
3 Ali Ahmed, et. al., “Outbreak of Vaccine-Preventable Diseases in Muslim Majority Countries,” Journal of Infection and Public Health, March-April 2018, pages 153-155.

Geographic reference: World
Year: 2018 and 2023
Market size: $39.3 billion and $81.2 billion
Sources: Stefan Marwa, “Global Halal Nutraceuticals & Vaccines Market Size to Worth USD 81,207 Million by 2023,” Healthcare Journal, April 9, 2018 available online here; “Halal Guidelines,” Halal International Certification Pvt Ltd., 2016 available online here; Conrad Hackett and David McClendon,” Christians Remain World’s Largest Religious Group, But They Are Declining in Europe,” Pew Research Center, April 5, 2017 available online here; Hamid Nasri, et. al., “New Concepts in Nutraceuticals as Alternative for Pharmaceuticals,” International Journal of Preventative Medicine, December 2014, pages 1487-1499 available online here; “What is Halal? A Guide for Non-Muslims,” Islamic Council of Victoria available online here; Ali Ahmed, et. al., “Outbreak of Vaccine-Preventable Diseases in Muslim Majority Countries,” Journal of Infection and Public Health, March-April 2018, pages 153-155 available online here; Salama, “AJ Pharma to Turn Malaysia into Halal Vaccine Hub,” Halal Focus, January 6, 2018 available online here; Pearl Liu, “Annual Hajj Points to Untapped, Growing Halal Vaccines Market,” BioWorld available online here; and “Global Nutraceuticals Industry Report: 2017-2021 – Analysis of the Multi-Billion Functional Food and Beverage Industries – Research and Markets,” PR Newswire Press Release, March 13, 2017 available online here.
Image source: kerkanno, “acupuncture-alternative-aroma-906144,” Pixabay, August 28, 2015 available online here.

“Legal” Marijuana Market

Although the Federal government considers possession of marijuana illegal and classifies marijuana as a Schedule I substance, one that has “no currently accepted medical use and a high potential for abuse” according to the Controlled Substances Act of 1970, all but eleven of the 50 states have decriminalized the possession of small amounts of marijuana at the state level. As of the end of 2016, twenty-four states have legalized some form of medical marijuana and eight states and the District of Columbia have legalized marijuana for recreational use. While the legalization of marijuana for recreational use is a new phenomenon—Colorado and Washington were the first states to legalize this activity in 2012—decriminalization at the state level began in 1973 and California was the first to legalize medical marijuana in 1996. Despite legalizing this drug, some states and municipalities are struggling with how to regulate this new industry. In Michigan, where medical marijuana has been legal since 2008, the governor didn’t sign legislation to regulate the industry until September 2016. Under the new regulations, the House Fiscal Agency estimates that annual medical marijuana sales will total $771 million, generating $21.3 million in state tax revenue. Michigan has 244,125 registered medical marijuana users and 40,702 registered caregivers.

Today’s market size shows the amount of revenue generated from legal medicinal and recreational marijuana sales in the United States in 2016 and projected sales for 2021.

Geographic reference: United States
Year: 2016 and 2021
Market size: $6.8 billion and $21.6 billion respectively
Sources: Kathleen Gray and Paul Egan, “Medical Pot Laws Creating a Frenzy,” Lansing State Journal, March 26, 2017, pages 1A, 15A and 17A; “Legality of Cannabis by U.S. Jurisdiction,” Wikipedia, available online here; “Timeline of Cannabis Laws in the United States,” Wikipedia, available online here; “Drug Schedules,” United States Drug Enforcement Administration, United States Department of Justice, available online here.
Original source: Arcview Market Research
Image source: Rexmedlen, “Cannabis-hemp-marijuana-1382955,” Pixabay, May 12, 2016 available online here.

Methamphetamine Laboratory Cleanup

MethLabs

The societal costs of the methamphetamine—crystal meth or simply meth for short—drug business, if we can call the trade in this illegal drug a business, is very difficult to calculate. It negatively impacts the health and welfare of the participants and the communities in which it is most active. These tend to be rural communities located in the mid-section of the country. The states fighting the largest battles with the meth trade are Missouri, Tennessee, Indiana and Kentucky.

The graph shows the number of methamphetamine laboratory incidents reported by the Drug Enforcement Administration (DEA) over the period 2004–2012. An incident is any seizure of a meth lab, a dump site or stashes of chemical and glassware. The graph also shows the quantity of methamphetamine seized by the DEA over this period.

There is one cost associated with the meth trade, of so many costs to society, that has been a stimulus to a legal business activity. That is the cost of cleaning up clandestine laboratories in which this drug is produced, or cooked in the vernacular of this trade. The methods used to make this drug also produce a lot of hazardous fumes and byproducts. Therefore, meth labs must be handled carefully and then thoroughly cleaned up after a seizure. The cost of such cleanups depends greatly on the size of the facility but it can run anywhere from $1,000 per site to $25,000 per site or even more in some extreme cases. Specially certified waste management firms and environmental consulting firms are contracted to carry out this cleanup work.

Today’s market size is the estimated amount spent in the United States cleaning up meth labs in 2012. Worth noting is the fact that this money was concentrated in the ten states in which most meth trade occurs. Together these ten states represent 82.4% of all meth lab incidents. For more details on which states have the highest level of meth activity, go to the DOJ website listed as the third source below.

Geographic reference: United States
Year: 2012
Market size: $29 million
Sources: (1) Jonah Engle, “Merchants of Meth,” Mother Jones, July/August 2013, page 33. (2) “DEA Domestic Drug Seizures,” part of a U.S. Department of Justice web site available online here. (3) “Methamphetamine Lab Incidents, 2004–2012,” another DOJ offering on its website here.
Original source: U.S. Department of Justice
Posted on November 22, 2013

Pharmacy Benefit Managers

The cost of prescription drugs in the United States is a subject about which there is much controversy. As the Affordable Care Act—or, Obamacare—gets off to a rocky start across the nation, we decided to look at just one small part of the prescription drug distribution network, about which most people are not particularly conscious. That is the segment made up of Pharmacy Benefit Managers (PBMs), middlemen who stand in a central position in the prescription drug supply chain and who, it turns out, have carved out for themselves a rather lucrative business. The three largest PBMs—Express Scripts, CVS Caremark, and OptumRx—together control about 70% of all prescriptions filled in the United States.

PBMs are firms that provide an administrative service to insurance companies, large self-insured employers, and government benefit providers. They develop and maintain drug formularies—lists of specific drugs to be covered and the prices for each—for their insurance providing customers. They also negotiate with pharmaceutical companies for preferred pricing on the drugs covered in those formularies and they negotiate with retailers to accept those terms and participate in the PBM’s network of preferred pharmacies.

According to an article in Fortune magazine, “PBMs started as paper pushers: They began hand-processing medical claims in the 1970s and evolved into middlemen who touted their ability to use corporate customers’ combined purchasing power to negotiate huge discounts from pharmaceutical companies. Today the top PBMs are as big as or bigger than their clients.” The United States has a unique health care delivery system, one which is significantly fuller of lucrative middleman-businesses than the systems present in other industrialized nations.

Today’s market size is the total estimated revenue earned by Pharmacy Benefit Managers in the United States in 2012.

Geographic reference: United States
Year: 2012
Market size: $250 billion
Source: Katherine Eban, “Painful Prescription,” Fortune, October 28, 2013, pages 202-207.
Original source: J.P. Morgan analysts
Posted on November 4, 2013

The Sleep Business

In 2012, approximately three-fourths of internet users searched online for health information. Half of them searched specifically for sleep remedies. According to the National Sleep Foundation, only 56% of Americans report getting a “good night’s sleep” on a typical night. Some sleep studies have found a link between insufficient sleep and hypertension, depression, diabetes, and other illnesses. Spending related to sleep has increased 8.8% yearly since 2008. Spending on over-the-counter sleep aids increased 31% from 2006 to 2011, with the biggest increase being spending on natural and homeopathic products.

Today’s market size is the estimated amount spent in the United States, in 2012, on things designed to aid sleep, from pills and medical devices to sleep consultants who work with hospitals and deluxe mattresses made with tension-relieving foams.

Wishing all our readers a sound night’s sleep!

Geographic reference: United States
Year: 2012
Market size: $32 billion
Source: Kit Yarrow, “The Sleep Industry: Why We’re Paying Big Bucks for Something That’s Free,” Time, January 28, 2013, available online here.
Posted on March 1, 2013

Growing Market for Epinephrine

Anyone with a child in school these days is likely to be very aware of the growing concerns related to food allergies. In many elementary schools in the United States, special tables in the lunch room are set aside for children whose lunches contain any nuts, like the traditional peanut butter and jelly sandwich. In some schools, foods containing nuts of any kind are banned entirely. This is because of a rising number of children who suffer from food allergies, particularly nut allergies, and the rising severity of their allergic reactions.

Nut allergies have been the fastest growing food allergies in recent years. In 1997, approximately 278,000 children under the age of 18 in the United States (0.04% of the age group) suffered from an allergy to peanuts. In 2008, that number had risen to over a million (1.5% of children in the age group).

Today’s market size is the estimated number of children (under the age of 18 years) in the United States who suffer severe food allergies. It is a calculation based on a study that showed that one in thirteen children suffer food allergies and that nearly 40 percent of those children suffer severe allergic reactions, severe enough to require the use of a drug like epinephrine to combat the reaction and save their lives.

Geographic reference: United States
Year: 2010
Market size: 2.28 million
Source: Katie Thomas, “Tiny Lifesavers for a Growing Worry,” The New York Times, September 8, 2012, page B1. Population data used to calculate today’s market size are from “Table 1. Population by Sex and Selected Age Groups: 2000 and 2010,” Age and Sex Composition: 2010, May 2011, one of the Census Bureau’s reports on the 2010 Census of the United States, available here.
Original source: A study published in the journal Pediatrics and referenced in the source article listed above.
Posted on September 12, 2012

Vitamin Sales

Today’s market size comes from a report about U.S. vitamin purchases published by a consumer analytics firm. The report goes into some detail about where people make purchases of vitamins and how that has been changing over the past few years.

Geographic reference: United States
Year: 2012
Market size: $12.2 billion
Source: “Vitamin Market Survey Sees Buyer Deficiency,” Progressive Grocer, August 3, 2012, available online here.
Original source: TABS Group
Posted on August 20, 2012

Pharmacy & Drug Stores

Drug Retailing

The sale of drugs, whether over-the-counter or prescription drugs, has been a healthy, growing business for a long time in the United States. The sale of these products through pharmacies and drug stores is the subject of our post today. The graph presents sales of these retailers over the period 1992–2010. The annual growth rate in sales over this period was 10.3%, a third faster than the economy as a whole, which grew at 7.2% annually.

Worth noting is the fact that over this same time period, the number of retail outlets selling drugs has increased as Big Box stores, grocery stores and others have gotten into the business of selling drugs with enthusiasm. Consequently, the role of pharmacies and drug stores in total drug sales has actually declined over this period.

Geographic reference: United States
Year: 2000 and 2010
Market size: $130.87 billion and $222.26 billion respectively
Source: Annual Retail Trade Survey 2009, and updates from the Monthly Retail Trade Reports from the same reporting series, U.S. Census Bureau, available online here.
Original source: U.S. Department of Commerce, Bureau of the Census
Posted on April 4, 2012

Prescription Drug Sales

Expenditures on health care in the United States have been much in the news for years now. The prices for prescription drugs are among the fastest growing of the segments of this overall industry. And yet, prescription drugs make up only around 10 percent of all expenditures on health care.

Today’s market size is the size of the market for prescription drugs sold through retail outlets in 2000 and 2010. In 2000 58 percent of the prescription drugs sold through retail outlets were brand name drugs. In 2010 brand-name drugs accounted for 29 percent of those sales.

Geographic reference: United States
Year: 2000 and 2010
Market size: $145.57 and $266.39 billion respectively
Source: Table 159. Retail Prescription Drug Sales,” Statistical Abstract of the United States 2012, page 113, U.S. Census Bureau, September 27, 2011, available here.
Original source: National Association of Chain Drug Stores
Posted on January 24, 2012

DTC Drug Advertising

Ad Spending

Direct-to-consumer (DTC) advertising of prescription drugs is a big business in the United States, as it is in New Zealand, the only other country in which this activity is legal. Anyone who watches TV for more than an hour or two a week will be more than familiar with the sorts of ads we are talking about, those that invariably end with an ominous list of potential side effects of the very drugs being pushed.

Until the late 1990s this advertising was quite limited by FDA regulations but in 1997 the FDA announced changes to those regulations (implemented in 1999) that freed up the pharmaceutical industry to start producing stylish ad campaigns for its most popular prescription drugs. The industry took full advantage, as the graph above clearly shows. Industry analysts suggest that the slowdown in spending starting in 2007 had more to do with the expiration of important brand name drugs (and their replacement with generics for which such spending is not done) than with the beginning of the recession.

Today’s market size is the amount spent by pharmaceutical companies on DTC prescription drug advertising in 2008.

Geographic reference: United States
Year: 2008
Market size: $4.57 billion
Source: For the data from 1989 through 2001: Francis B. Palumbo and C. Daniel Mullins, “The Development of Direct-to-Consumer Prescription Drug Advertising Regulations, Food and Drug Law Journal, Volume 57, Number 2, 2002. For the data from 2002 through 2005: Donahue Ph.D., Julie M., Marisa Cevasco, B.A. and Meredith B. Rosenthan, Ph.D., “A Decade of Direct-to-Consumer Advertising of Prescription Drugs,” The New England Journal of Medicine, August 16, 2007. For data from 2006 through 2008 the data are from Nielsen Media press releases.
Posted on January 20, 2012