Unified Endpoint Management

Unified Endpoint Management consists of software tools that provide a single management interface for a variety of devices on multiple platforms.
Geographic reference: World
Year: 2019 and 2027
Market size: $2.75 billion and $23.98 billion, respectively

Today’s market size shows total global revenues for unified endpoint management (UEM) in 2019 and projected for 2027. UEM consists of software tools that provide a single management interface for a variety of devices (endpoints) such as desktop computers, tablets, smartphones, printers, Internet of Things devices, and wearables. UEM tools allow IT departments to configure, control, and manage devices on multiple platforms: Windows 10, macOS, Android, iOS, Chrome OS, Linux, among others. These tools also allow for simplified migration from legacy platforms to newer ones. 

In 2019 there were 1,506 data breaches in the United States alone, exposing more than 164 million records. In 2018, more than 471 million records were compromised. With more people working from home, especially during the pandemic, the need for organizations to remotely manage and secure a variety of devices on third-party networks in addition to their own networks is critical. More and more employees are accessing corporate networks and data from their personal devices; the devices themselves, and the software on them, aren’t sanctioned by the companies’ IT departments. Also, employees may be working while using unsecured home or public Wi-Fi hotspots. In the past most security breaches happened within a corporate network, now breaches are increasingly coming from unsecured endpoints. Some UEM tools use zero-trust security that blocks users whenever they try to access a different part of an organization’s network. Users are not automatically granted access because they have previously been granted access. Therefore, if a breach takes place, only part of the network is compromised.

UEM evolved from mobile device management and enterprise mobility management. Mobile device management allowed IT departments to manage mobile devices remotely, but these devices were dedicated to certain limited uses. Enterprise mobility management incorporates both mobile device management as well as mobile content management — document and data security and device-specific app management. These solutions, however, take a piecemeal approach to provide security and management features for legacy, desktop, mobile, and IoT devices. UEM provides users with “a comprehensive solution that requires organization through a single pane of glass, making the management process simpler overall.”1 This unified approach also helps organizations comply with government regulations such as GDPR by allowing administrators to encrypt multiple databases and their contents while maintaining compliance regulations. UEM tools provide auditing and reporting functionality to meet these requirements.

Large organizations held a 74% revenue share in 2019. This segment is expected to continue to hold the majority share through 2027. Growth is expected as more large organizations adopt a variety of endpoint solutions, complicating IT management. The increasing risk of cyber threats against large firms is also expected to spur growth. The fastest revenue growth, however, is expected to come from small and medium-sized businesses (SMEs) as they adopt more cloud-based solutions and increasingly need to secure company-owned as well as employees’ personal devices. The need to manage compliance requirements is also spurring SMEs to adopt UEM solutions. 

Businesses in the telecommunications and IT sectors held the highest market share in 2019, followed by the banking, financial services, and insurance sector, and government and defense. UEM in the healthcare sector is expected to experience the highest growth as more healthcare institutions adopt mobile and other IoT devices to remotely communicate, collaborate, and share critical information. Increased adoption of blood pressure monitors, wearable devices, and other cloud-based devices will also contribute to the growing adoption of UEM solutions.

North America claimed 42% of the market in 2019 and is expected to continue to hold the largest share through 2027 as companies continue to invest in advanced technologies to simplify their business operations. The Asia Pacific region is expected to experience the fastest growth over this time period. Organizations in this region are increasingly adopting mobile devices and IoT applications as well as cloud-based solutions and “bring your own device” policies. 

The market is fragmented with both large and emerging companies offering a range of UEM solutions. In some cases, UEM vendors are forming partnerships and collaborations in addition to acquiring companies to maintain their market share. Some major companies offering UEM solutions include 42Gears Mobility Systems Pvt. Ltd., BlackBerry Ltd., Citrix Systems Inc., IBM, Matrix42 AG, Microsoft, MobileIron Inc., Sophos Ltd., SOTI Inc., Zoho Corp., Ivanti, and VMWare Inc.

1 Source: Tess Hanna, “UEM or EMM: What’s Better for Endpoint Management? Mobility Management Solutions Review, October 26, 2018 available online here.

Sources: “Unified Endpoint Management Market Size $23.98 Billion by 2027: Grand View Research, Inc. – Press Release – Digital Journal,” Journal of Cyber Policy, October 8, 2020 available online here; “Unified Endpoint Management Market Size $23.98 Billion by 2027: Grand View Research, Inc.,” Digital Journal Press Release available online here; “Unified Endpoint Management Market Size, Share & Trends Analysis Report by Component (Solution, Services), by Organization Size (SMEs, Large Enterprises), by Vertical, by Region, and Segment Forecasts, 2020 – 2027,” Grand View Research Report Summary, September 2020 available online here; “What is Unified Endpoint Management?” VMware Glossary available online here; Tess Hanna, “UEM or EMM: What’s Better for Endpoint Management? Mobility Management Solutions Review, October 26, 2018 available online here; J. Clement, “Cyber Crime: Number of Data Breaches and Records Exposed 2005-2020,” Statista, October 1, 2020 available online here.
Image source: Gerd Altmann, “binary-one-cyborg-cybernetics-2302728,” Pixabay, May 11, 2017 available online here.

Smart Robots

smart robots
Smart robots have artificial intelligence systems that allow them to learn from their environment and experience. They are designed to do tasks without the supervision of humans but they can also collaborate with and work beside human beings and learn from human behavior. 1

Today’s market size shows the revenues from smart robots in 2017 and projected for 2025. Because of their accuracy and efficiency, smart robot adoption is significantly higher in the manufacturing, automotive, healthcare and retail industries. Smart robots for manufacturing dominated the industrial segment of the market in 2017. Smart vacuum cleaners constituted most of the residential segment. Growth in this segment is expected to come from increased demand for other types of smart household cleaning machines (mopping, lawn mowing, pool cleaning) as well as for smart vacuums.

Mobile robots and robots used in a healthcare setting comprise the majority of the professional services segment. Autonomous mobile robots can dynamically re-route themselves due to their advanced sensory and enhanced intelligence systems. As a result no special infrastructure alterations are needed to deploy these devices. This capability gives them an advantage over autonomous guided vehicles that have been used mainly for warehouse distribution and logistics applications. Smart robots used in a healthcare setting are helping doctors perform surgery, disinfecting hospital rooms, providing precise radiation therapy for cancer treatment, and transporting meals, linens, lab samples, waste and other items throughout hospitals. Smart robots such as PARO, a fuzzy, baby harp seal-shaped therapeutic robot, provide comfort, reduce stress, and help improve the socialization skills of people with dementia and similar conditions.

Since the outbreak of COVID-19, disinfection robots have been in high demand. Chinese hospitals have ordered more than 2,000 UVD robots from Blue Ocean Robotics alone. These robots move autonomously around patient and operating rooms using UV-C light to kill 99.99% of viruses and bacteria throughout the room in about 10 minutes. If a person enters the room, the robot automatically shuts off the UV-C light. A device such as this can also be used in offices, schools, shopping malls, airports, and manufacturing facilities.

Notwithstanding the demand caused by COVID-19, growth in the overall smart robot market is expected to be caused by several factors: increasing demand for service robots, increasing adoption of artificial intelligence and Internet of Things applications, falling prices due to innovation and a proliferation of the technology, and the use of robotics in mobile and other smart devices. Government and venture capital funding for smart robots and related technologies is also expected to enhance demand in the near future. Leading manufacturers include ABB Ltd; iRobot Corp.; Kuka AG; Fanuc Corp.; Yaskawa Electric Corp.; Panasonic Industry Europe GmbH; OTC Daihen Inc.; Kawasaki Heavy Industries; Intuitive Surgical Inc.; and Omron Adept Technologies, Inc.

1 See also our Collaborative Robots post.

Geographic reference: World
Year: 2017 and 2025
Market size: $4.06 billion and $17.56 billion, respectively
Sources: “Smart Robot Market by Component (Hardware and Software), Application (Welding & Painting, Assembling & Disassembling, Mobility, Inspection & Security and Others), Industry Vertical (Automotive, Manufacturing, Electrical & Electronic, Food & Beverage, Chemical, Residential, and Others) – Global Opportunity Analysis and Industry Forecast, 2018-2025,” Allied Market Research Report Overview, June 2018 available online here; “Smart Robots Market Size, Share & Trends Analysis Report by Component (Hardware, Software, Service), by Application, by End Use (Industrial, Commercial, Residential), by Vertical, by Region, and Segment Forecasts 2018-2025,” Grand View Research Report Summary, October 2018 available online here; “5 Medical Robots Making a Difference in Healthcare,” Case Western Reserve University, Case School of Engineering, December 28, 2017 available online here; “Executive Summary World Robotics 2019 Service Robots,” International Federation of Robotics, September 18, 2019 available online here; Bennett Brumson, “New Applications for Mobile Robots,” Robotics Industry Insights, April 5, 2012 available online here; Angela Johnston, “Robotic Seals Comfort Dementia Patients But Raise Ethical Concerns,” KALW, August 17, 2015 available online here; “Robots Help to Fight Coronavirus Worldwide,” International Federation of Robotics Press Release, March 31, 2020 available online here; “PARO Therapeutic Robot” available online here.
Image source: Pete Linforth, “connection-hand-human-robot-touch-3308188,” Pixabay, April 10, 2018 available online here.

Virtual Private Servers

A virtual private server (VPS) runs on a physical computer server that has been partitioned into multiple virtual machines. Each virtual machine runs its own instance of a VPS, with its own operating system, custom configuration, and dedicated RAM and CPU. VPSes are used for website hosting and are usually provided as an option by web hosting companies.

Other types of web hosting include shared hosting and dedicated hosting. Shared hosting is the least expensive option, each client sharing the cost of one server. Shared hosting involves hundreds or thousands of websites sharing the same server resources. Unlike a VPS, which has its own dedicated RAM and CPU, websites that use shared hosting risk slow site performance if one or more websites on the server are monopolizing the server’s processing power.1 Dedicated hosting, the most expensive option, involves only one client per server. This type of hosting offers companies the most flexibility with the ability to choose an operating system, types of memory, and other hardware.

Cost-wise, VPS hosting is in the middle of shared hosting and dedicated hosting. A single server generally has between 10 and 20 VPSes, and server resources are split evenly. One client’s website performance does not affect another’s. This option also allows for flexibility in the configuration of the environment, choosing a particular operating system or other software, for example.

Today’s market size shows the total companies spent on virtual private servers worldwide in 2018 and projected for 2023. According to the source, Linux will garner the largest market share among VPS operating systems during this time period. North America was the largest market for VPSes in 2018, but the compound annual growth rate is expected to be highest in the Asia-Pacific region to 2023. Leading vendors include AWS, United Internet, GoDaddy, Endurance International Group, OVH, and DigitalOcean, to name a few.

1 Generally web hosting companies have procedures in place to prevent this scenario, but it is still a risk, however small.

Geographic reference: World
Year: 2018 and 2023
Market size: $2.4 billion and $5.0 billion, respectively
Sources: “The Global VPS Market Size is Expected to Grow from USD 2.4 Billion in 2018 to USD 5.0 Billion by 2023, at a Compound Annual Growth Rate (CAGR) of 15.3%,” PRNewswire, April 10, 2019 available online here; John Stevens, “Different Types of Web Hosting, ” Hosting Facts, June 14, 2018 available online here; John Stevens, “11 Best VPS Hosting Options,” Hosting Facts, March 15, 2019 available online here.
Image source: Patrick Neufelder, “server-space-the-server-room-dark-2160321,” Pixabay, March 21, 2017 available online here.

Firewall as a Service

cloud computing security firewallA firewall prevents unauthorized access to a network based on a defined set of security rules. For more than two decades firewalls have been used to provide network security. Firewalls can be hardware-based or software-based or both.

Firewall as a Service (FWaaS) is a cloud-based service in which an organization’s firewall is centralized to monitor traffic coming from multiple locations within the organization, from mobile users and the internet. Without using FWaaS, employees in a company’s IT department may spend time maintaining multiple firewalls in multiple locations. Besides responding to cyber threats, this includes updating hardware and software to thwart new threats or to comply with new government regulations and verifying that security rules are consistent throughout the network. FWaaS creates a centralized point of access for network traffic with the ability to automatically scale the service depending upon need, adding more network locations or adding bandwidth capabilities. The provider of these services is responsible for maintaining the firewall infrastructure. FWaaS providers have dedicated security teams that monitor systems, provide necessary updates and respond to network security threats.

Today’s market size shows the amount spent globally on FWaaS in 2017 and 2022. Data for 2022 are projected. The market is expected to grow at a compound annual growth rate of 24.9% from 2017 to 2022. An increasing need for more sophisticated network security, the ability to rapidly upgrade firewall protocols, and reduced operating costs are some reasons the demand for FWaaS is expected to increase over the next 5 years. Major vendors of FWaaS are Barracuda Networks, Cato Networks, Check Point Software Technologies, Cisco Systems, Forcepoint, Fortinet, Juniper Networks, Palo Alto Networks, WatchGuard, and Zscaler.

Geographic reference: World
Year: 2017 and 2022
Market size: $0.56 billion and $1.70 billion respectively
Sources: “Firewall as a Service Market Worth 1.70 Billion USD by 2022,” Cision PR Newswire, March 2, 2018 available online here; Dave Greenfield, “What is Firewall as a Service and Why Do You Need It?” Cato Networks, April 16, 2018 available online here; Alan Zeichick, “Understanding Cloud-Based Firewalls,” enterprise.nxt, February 20, 2017 available online here; “What is a Firewall?” Cisco, available online here.
Original source: MarketsandMarkets
Image source: wynpnt, “cloud-computing-network-internet-2001090,” Pixabay, January 23, 2017 available online here.

Web Application Firewalls

CybersecurityA web application is a computer program that uses an internet browser as a client interface. Some examples of web applications are email clients such as Gmail; productivity applications such as G Suite and Microsoft 365, which include word processors and spreadsheets; and multi-player online gaming applications. Online banking and investing websites that allow users to access their accounts and perform transactions are also examples of web applications. As these applications have gotten more complex and the storage of sensitive data has gotten more prevalent, the need for sophisticated security has increased.

One type of security measure is a firewall. A firewall prevents unauthorized access to a network based on a defined set of security rules. For more than two decades firewalls have been used to provide network security. Some types of firewalls include packet-filtering, state-inspection, unified threat management, and next-generation. Early firewalls examined the packets that came through the network, but they couldn’t distinguish between valid application layer protocol requests, data, and malicious code disguised as valid traffic or data. The need for application layer protection became necessary as attacks against web servers became more frequent. Benefits of application layer firewall protection include being able to block specific content or websites, control the execution of files and control the handling of data by specific applications.

Today’s market size shows the amount spent on web application firewalls globally in 2017 and projected for 2023. Governmental organizations and e-commerce companies are the top two targets of cyber attacks. The organizations themselves are not the only ones vulnerable to attack. The malware that infects the web application can infect the users’ computers also.

Geographic reference: World
Year: 2017 and 2023
Market size: $2.37 billion and $5.92 billion respectively
Sources: “Global Web Application Firewall Market 2018-2023 – Segmented by Component, Organization Size, Industry Vertical, and Region – ResearchAndMarkets.com,” Business Wire Press Release, May 14, 2018 available online here; Margaret Rouse, Casey Clark and Michael Cobb, “Firewall,” TechTarget, February 2018 available online here; “What is a Firewall?” available online here; Daniel Nations, “What Exactly Is a Web Application?” Lifewire, February 22, 2018, updated by Elise Moreau available online here.
Image source: JanBaby, “security-secure-locked-technology-2168233,” Pixabay, March 23, 2017 available online here.

Bitcoin Ransomware Payments

RansomwareAccording to the 2018 Data Breach Investigations Report, in 2017 there were 53,308 cybersecurity incidents worldwide with more than 2,200 data breaches. As a percentage of all malware incidents, ransomware incidents have risen dramatically since 2013. More than 40% of malware incidents involved ransomware in 2017. Ransomware is a type of malicious software that prevents a user from accessing their computer or mobile device, either by disabling the operating system or encrypting files, until a ransom is paid. The ransom usually totals a few hundred dollars per infected computer. Ransomware can infect servers as well as individual devices. People clicking on an infected email attachment, visiting infected websites or clicking on ads that contain malware are some ways that computers can get infected. Ransomware targets vulnerabilities in software. Updates to software attempt to remove these vulnerabilities so that cybercriminals can’t exploit them.

According to the FBI, ransomware infects more than 100,000 computers worldwide per day and payments to cybercriminals total nearly $1 billion per year. However, the cost of a ransomware attack goes beyond the payment to the attacker. Even after paying the ransom about 20% of companies do not get their data back. The costs associated with business downtime, recovery of files and increased spending on cybersecurity are many times greater. According to Kaspersky Lab, in 2016 the average ransom demand was $300, but the average cost to a small to medium-sized company due to a ransomware attack was $99,000. Globally, the cost of cybercrime is expected to reach $6 trillion by 2021, up from $3 trillion in 2015. Today’s market size shows the minimum amount of ransom paid to cybercriminals in Bitcoin from 2013 to mid-2017 based on analysis of 35 ransomware families. As of May 2018, there were more than 500 known families of ransomware that demand Bitcoin as payment.

Geographic reference: World
Year: 2013 to mid-2017
Market size: $12.8 million
Sources: Alex Lielacher, “Size of Bitcoin Ransomware Market ‘Overhyped’ in the Media,” Brave NewCoin, April 23, 2018 available online here; “Deputy Attorney General Rod J. Rosenstein Delivers Remarks at the Cambridge Cyber Summit,” The United States Department of Justice, October 4, 2017, updated October 6, 2017 available online here; Masara Paquet-Clouston, et. al., Ransomware Payments in the Bitcoin Ecosystem, May 2018 available online here; 2018 Data Breach Investigations Report, 11th Edition, Verizon, April 2018 available online here; “The Cost of Cryptomalware: SMBs at Gunpoint,” Kaspersky Lab Daily, September 7, 2016 avalable online here; Tamara Chuang, “Inside the Profitable Underworld of Ransomware,” Government Technology, March 5, 2018 available online here.
Image source: TheDigitalArtist, “ransomware-cyber-crime-malware-2320941,” Pixabay, May 18, 2017 available online here.

Database Security

database securityGlobally the number of cyber security incidents increased 1,637% from 3.4 million incidents in 2009 to more than 59 million incidents in 2015. In the United States the number of data breaches alone increased from 446 in 2007 to 1,579 in 2017. According to Steve Langan, chief executive at Hiscox Insurance, cybercrime cost the global economy more than $450 billion dollars in 2016.

As a result of the growing threats from viruses, worms, Denial of Service attacks and other malware the need for increasingly sophisticated cyber security solutions grows year by year. In 2017 the business sector was the most vulnerable to data breaches in the United States followed by the medical/healthcare sector, accounting for 55% and 23.7% of all data breaches respectively.

Today’s market size shows the amount industries around the world spent on database security in 2017 and the amount they are projected to spend in 2022. The market is expected to grow at a compounded annual growth rate of 18.9% due to the increase in the amount of data that needs protecting, the increase in malware threats, and the increase in regulations protecting the privacy and security of customers’ health and financial data.

Geographic reference: World
Year: 2017 and 2022
Market size: $2.95 billion and $7.01 billion respectively
Sources: “Database Security Market by Software, Service, Business Function, Deployment, Organization Size, and Vertical Global Forecast to 2022 – Research and Markets,” Business Wire Press Release, January 2, 2018 available online here; “Global Number of Cyber Security Incidents From 2009 to 2015 (in Millions),” Statista, October 2015 available online here; Luke Graham, “Cybercrime Costs the Global Economy $450 Billion: CEO,” CNBC, February 7, 2017 available online here; “Data Breaches: The Insanity Continues,” Identity Theft Resource Center, 2015 available online here; “2017 Annual Data Breach Year-End Review: Executive Summary,” Identity Theft Resource Center, 2017 available online here.
Image source: Geralt, “Binary-hands-keyboard-tap-enter-2372131,” Pixabay, June 2017 available online here.

Collaborative Robots

Global Sales of Collaborative Robots
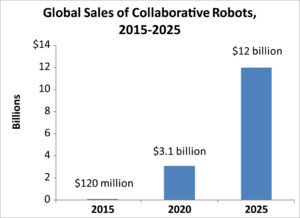
Collaborative robots, or co-bots, are robots that work alongside human workers. Many workers are wary of the increased use of robots in general, fearing the loss of their jobs. M.I.T. and Boston University estimated that up to six people lose their jobs for each robot per 1,000 workers a company adds. Employers, however, cite increased productivity, cost savings, and healthier work environments when robots are used in the workplace. Robots can work in hazardous jobs or do repetitive tasks thereby reducing worker injuries.

Today’s market size shows the total global sales of collaborative robots in 2015, 2020, and 2025. Figures for 2020 and 2025 are projections. According to the Robotic Industries Association, the United States is third behind Japan and China in the total number of industrial robots in use—250,000 in 2017. According to the Brookings Institution, metro Detroit has more than 15,000 industrial robots in place, almost five times the number of any other major city in the U.S.

Geographic reference: World
Year: 2015, 2020 and 2025
Market size: $120 million, $3.1 billion (projected) and $12 billion (projected).
Source: Dolan, Matthew, “Rise of the Robots,” Lansing State Journal, October 30, 2017, page 8A.
Original source: Barclays Equity Research analysts

International Data Flow

The World Wide Web. A decentralized network of data stored on servers all around the world. But many countries—China, Russia, Germany, and Belgium, to name a few—are enacting laws requiring multinational companies to store and process country-specific data on local servers. According to the source, relaxing such restrictions has become a priority of President Donald Trump’s administration as they negotiate trade agreements, including the upcoming renegotiation of NAFTA.

Proponents of these laws say that having their users’ data stored locally aids in cyber security. Opponents say that storing data on local servers is more expensive, especially for small to medium sized companies. High tech companies worry about having their source codes stolen. Some companies worry that governments or political groups will use the data stored on these servers for illegitimate reasons. And many argue that limiting data flow also limits job growth and innovation. According to Nigel Cory, a trade policy analyst at the Information Technology and Innovation Foundation, “data needs to flow to create value.”

Today’s market size is the estimated value of data flowing through international borders in 2014, according to a report by the McKinsey Global Institute.

Geographic reference: World
Year: 2014
Market size: $2.8 trillion
Sources: Yu, Roger, “More Firms Push Back on Foreign Data Rule,” USA TODAY for the Lansing State Journal, August 13, 2017, page 4B
Original source: Manyika, James, et. al., Digital Globalization: The New Era of Global Flows, McKinsey Global Insitute, February 2016 available online here.
Image source: Geralt, “Binary-hands-keyboard-tap-enter-2372131,” Pixabay, June 2017 available online here.

Automotive Semiconductors

Semiconductors—the essential foundation upon which modern electronics rest—are found in all electronic devices as well as many products that one would not initially think of as electronic, such as greeting cards with embedded audio chips in them to produce music upon opening. The use of semiconductors in the automotive industry has made the modern car/truck one of the most advanced electronic devices most people own, often without even knowing it.

Semiconductors are, in the simplest terms, elements like germanium and silicon that conduct electricity at only moderate rates, thus they are “semi” conductors. These elements are used to make the semiconductor chips that are embedded in electronic devices to allow the use of electrical currents as a signal. All cybernetics rely on this type of signaling.

Today’s market size is the estimated value of the automotive semiconductor market, worldwide, in 2012 (when it represented 8.1% of the total world semiconductor market) and a projection of the market’s value in 2020.

Geographic reference: World
Year: 2012 and a projection for 2020
Market size: $23.4 billion and $33.5 billion respectively
Sources: (1) Gary S. Vasilash, “The Supercomputer in Your Garage,” Car and Driver, December 2013, page 34. (2) Monique D. Magee, editor, “Semiconductors,” Market Share Reporter: Trends Over Time, GALE Cengage Learning, 2012, page 553.
Original source: Strategy Analytics
Posted on November 15, 2013

Bioinformatics

Over the last decade bioinformatics has been characterized by the mapping of many genomes. This has fueled explosive growth in the field generally, growth which is anticipated to continue into the future.

Bioinformatics, in the most basic sense, is the application of information technology to the life sciences to increase the understanding of biological and chemical processes. It is the study of the methods for storing, retrieving and analyzing biological data, a wealth of which is growing rapidly and thus feeding demand for more bioinformatics. Fields that benefit from the output of bioinformatics are many, including especially agricultural biotechnology, pharmaceutical research and development, and medical and clinical diagnostics.

Today’s market size is the estimated value of this hybrid industry in 2012 and a projected value for 2018.

Geographic reference: World
Year: 2012 and 2018
Market size: $2.3 billion and $9.1 billion respectively
Source: “Global Bioinformatics Market is Expected to Reach USD 9.1 Billion in 2018: Transparency Market Research,” The Herald, November 28, 2012, a link to which is here.
Original source: Transparency Market Research, whose study on this industry may be purchased on their website here.
Posted on November 28, 2012

Home Wireless Routers

Many people who own tablet computers, laptops, and e-readers own wireless routers. Wireless routers allow them to connect to the Internet through these devices from anywhere in their homes. Data show sales of home wireless routers in 2005 and 2011.

Geographic reference: United States
Year: 2005 and 2011
Market Size: $700 million and $1.3 billion respectively
Source: Tamara Chuang, “When the Home’s Most Important Internet Device Fails,” The Street, September 17, 2012, available online here.
Original Source: Dell’Oro Group
Posted on September 26, 2012

Data Loss

That sinking feeling… we have all probably been there, face to face with a computer we count on that has begun to act up. The loss of data resulting from computer hardware failure, software corruption or even human error, is painful and costly. Measuring the loss is a difficult task but one that was undertaken by Dr. David M. Smith and reported on in the article from which we source today’s market size post. A full citation is below.

Specifically, the market size presented here is the estimated annual loss to businesses in the United States due to data losses on PCs and laptops. It dates back to 2003 but it provides us with a scope for the problem and a scope that we know has only grown. For further details, check the source article which defines things clearly.

Geographic reference: United States
Year: 2003
Market size: $18.2 billion
Source: David M. Smith, “The Cost of Lost Data,” Graziadio Business Review, 2003, available online here.
Original source: Graziadio School of Business and Management, Pepperdine University
Posted on December 1, 2011

Computers in the U.S.

The steady rise in demand for computers and electronic computing devices in the United States appears, when charted, as a line moving in exactly the opposite direction as the domestic production and shipments of these same products. This is an industry (NAICS 334111) that highlights a trend towards increasing consumption of a product and declining production of the same which feeds the U.S. trade imbalance. But that leads us to complex questions we don’t really want to address here. Here, we present market sizes and today’s is based on the value of Electronic Computer Manufacturing in the United States in 2000 and 2010 as well as the value of net imports of the same products in 2000 and the forecasted value for 2010.

Geographic reference: United States
Year: 2000 and 2010
Market size: U.S. manufacturing $69.3 and $27.9 billion
Market size: Net imports $89.4 and $199.3 billion
Source: Computer value of shipments from Annual Survey of Manufactures 1997, and the 2002 Economic Census. Net imports of Electric and Electronic Equipment from Statistical Abstract of the United States: 2000. Net imports of Computers and Electronic Products from Statistical Abstract of the United States: 2012.
Posted on November 29, 2011

Compact Discs

US Production of CDsCompact discs, or CDs, appeared on the recording media scene and rapidly became the standard, demand for them growing in leaps and bounds. But their position as market leader was a passing thing. As digital recording media they are still used but in ever smaller numbers, as the graphic shows. Part of the decline in production is the result of production going overseas. But a shift in how we record and store digital information is the primary cause for the decline of CDs.

Today’s market size is the value of U.S. manufacturer shipments of CDs in 2009. These values refer to blank CDs, to the storage media and not products later sold and distributed on that compact disc media.

Geographic reference: United States
Year: 2009
Market size: $4.27 billion
Source: “Table 1139. Recording Media—Manufacturers Shipments and Value: 2000 to 2009,” Statistical Abstract of the United States: 2011, January 20, 2011, page 716, available online here.
Original source: U.S. Census Bureau

The Public Cloud

Cloud computing is, in the simplest terms, the use of a remote location, accessible through the Internet, to store the data and applications used on a computer. We discuss this market in more detail in a post from May 3rd. Today’s market size is the size of the public cloud which is defined by the source as a service that is commercially offered to an “unrestricted marketplace of potential users.”

Geographic reference: World
Year: 2010 and forecast for 2015
Market size: $21.5 and $72.9 billion respectively
Source: Larry Dignan, “IDC: Public Cloud Market Will Hit $72.9 Billion in 2015,” ZDNet, June 20, 2011, available online here.
Original source: IDC

VOIP Providers

Today’s market size is based on the revenues earned by Voice Over Internet Protocol (VOIP) providers in 2010. VOIP saw a tremendous 194 percent growth from 2000 to 2010. This industry is expected to grow another 17.4 percent from 2010 to 2016.

Geographic reference: United States
Year: 2010
Market size:: $12.5 billion
Source: Phil Izzo, “Top 10 Thriving Industries,” The Wall Street Journal, May 16, 2011, available online here
Original source: IBIS World

Cloud Computing

A term we hear quite often these days is cloud computing. The personal computer revolution was, in part, a step away from what were then the large, centralized mainframe computers on which data was stored and accessed through workstations. With a personal computer, one had everything on his or her own device. Now, in a way, there is a decoupling again of the data from the device. Cloud computing is, in the simplest terms, the use of a remote location, accessible through the Internet, to store the data and applications used on a computer—instead of a hard drive on the local computer or local network of computers.

This is a growing business but one whose boundaries are still being defined, which makes it difficult to measure. It is hard to keep the image of a person trying to measure a cloud from coming to mind. Consequently, one can find many different size estimates for cloud computing, the differences usually having to do with how the market is defined. What we present here is an estimate of the revenue from business cloud services—hardware and software infrastructure as well as the leasing of space—so it does not include, for example, the services provided to people wishing to back-up their family photo albums. Cloud computing services to the individual is another large business and one that may be included in other estimates of the nebulous cloud computing market.

Geographic reference: World
Year: 2010 and forecast for 2014
Market size: $22.2 billion and $55.5 billion respectively
Source: Lohr, Steve, “The Business Market Plays Cloud Computing Catch-Up,” The New York Times, April 15, 2011, page B16
Original source: IDC