Seaborne Freight

SeaborneFreight

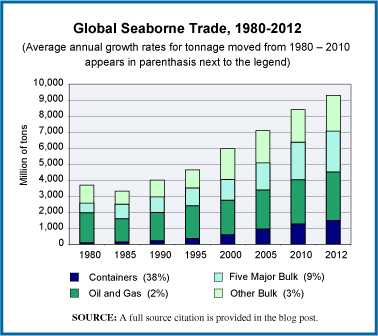
The most energy efficient means of moving freight is by moving it over water. The increase in global trade over the last few decades and particularly the increase in moving raw materials long distances as part of the overall manufacturing process has meant a significant rise in seaborne freight. The chart we offer here shows that increase by charting the tonnage moved annually by sea, broken into three categories: (1) tonnage moved in shipping containers, (2) movements of oil and gas, and (3) movements of cargo in bulk which includes all those things which may be moved in a dry cargo container ship. This final category is further broken down into the five major bulk products and all other bulk. The five major bulk products are iron ore, grain, coal, phosphates and bauxite.

The overall trajectory of growth is clear. What may not be quite as clear is the growth in how much of that freight is moved in container ships, the category shown in blue at the bottom of each bar. The growth of containerized freight movements has been the most striking. Over the period 1990 to 2012 the movement of containerized freight, when measured in tons moved, increased by 16% per year For those interested in more on container shipping, here’s a link to an earlier post we did covering the container ship market.

Today’s market size is the number of tons of freight moved by sea in 2000 and 2012. Of these totals, the percentage of freight moved in container ships, and thus, for the most part, finished goods as opposed to raw materials, was 10% in 2000 and 16% in 2012.

Geographic reference: World
Year: 2000 and 2012
Market size: 5,984 and 9,297 million tons respectively
Source: “Figure 1.2 International Seaborne Trade, by Cargo Type, Selected Years, 1980-2012,” Review of Maritime Transportation 2012, United National Conference on Trade and Development, 2013, page 9, available online here.
Original source: United Nations
Posted on August 19, 2013

Peppermint Oil

Chart

The price of mint oil, both peppermint and spearmint, has gone up sharply since the recession that started at the end of 2007. The chart shows the value of U.S. mint oil production from 2000 through 2012. Much of the increase has been due to the increased price of mint oil and not increased production. In fact, the production of peppermint oil fell over this period by 6.7% while the total value of the peppermint oil produced rose by 108%. Spearmint oil production over this period grew by 8.7% and the value of that oil grew by 134%.

Today’s market size is the number of pounds of peppermint oil produced in the United States in 2000 and 2012 and the value of the oil produced each year.

Geographic reference: United States
Year: 2000 and 2012
Market size: 7,063 pounds valued at $76.28 million and 6,592 pounds valued at $158.86 million respectively
Source: Crop Values – 2012 Summary, February 2013, page 43 and earlier reports in this annual series. These reports are produced by and put out annually by the United States Department of Agriculture, accessible in multiple formats on their website here.
Original source: USDA
Posted on May 24, 2013

Commodity Contract Dealers

Commodity Contract Dealers Industry 1997-2010

With the growth of globalization and the rise in consumption levels in many parts of the world, the cost of basic commodities has been on a strongly upward trajectory but one with great fluctuations. Such fluctuations in commodity prices tend to favor attempts to trade in futures by way of limiting the uncertainty of volatile prices. The services of commodity contract dealers have been in high demand and they have done quite well. The growth in both revenue and employment in the commodity contracts business shows how it has survived the recession and financial crisis of 2007–2009 far better than most industries.

The graphic presents annual revenue and payroll for Commodity Contract Dealers [NAICS 523130] in the United States from 1997 through 2010. Over this period, industry revenues grew by a very healthy 290% and payroll grew by an even more impressive 549%. In 1997, payroll accounted for 15% of revenue for this industry. In 2010 payroll accounted for 25% of revenue, off from a high of 34.5% of revenue reached in 2008. The total number employed by this industry also grew over the period 1997–2010, by 152%, from 4,519 to 11,400.

Today’s market size is the total industry revenue generated by commodity contract dealers in the United States in 2010.

Geographic reference: United States
Year: 2010
Market size: $8.75 billion
Source: Economic Census reports on the NAICS industry 523130 from the 1997, 2002, and 2007 Economic Censuses. The 2003 and 2010 editions of the Service Annual Survey, “Table 4.1. Finance and Insurance (NAICS 52) — Estimated Revenue fro Employer Firms.” All of these reports are available online from the Census Bureau’s website here.
Original source: U.S. Department of Commerce, Bureau of the Census
Posted on November 1, 2012