Bubble Tea

bubble tea
Geographic reference: World
Year: 2019 and 2027
Market size: $2.1 billion and $4.2 billion, respectively

April 21st is National Tea Day in the United Kingdom. Founded in 2016 to inspire the world to drink more tea, this date was chosen because it is also Queen Elizabeth’s birthday. Worldwide, tea is the second-most consumed nonalcoholic beverage behind packaged water. National Bubble Tea Day was first celebrated on April 30, 2018, as a marketing strategy for Kung Fu Tea in New York. This bubble tea franchise currently has locations throughout most of the United States.

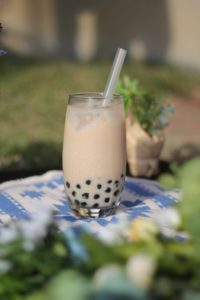
Today’s market size shows global revenues for the tea-based drink called bubble tea (or boba) for 2019 and projected for 2027. Bubble tea was invented in Tiachung, Taiwan in the early 1980s. Traditionally, it contained brewed tea, dairy milk, black tapioca pearls, and a sweetener such as honey or sugar. Newer varieties contain assorted flavorings and can be fresh-fruit-based. Milk-based bubble tea can contain soy milk, almond milk, or other non-dairy milk varieties. The chewy black tapioca pearls, made by boiling and steeping white tapioca pearls in caramelized sugar for hours, are what give bubble tea its name.1 There are currently more than 21,000 boba shops in Taiwan, and thousands more in North America, Europe, and other parts of Asia. Boba’s popularity began in earnest over the last decade as Instagram, the new word-of-mouth advertising, became popular in Taiwan. Since then, the variety of boba offered by shops has expanded greatly as these businesses compete to offer something new to attract customers.

Black tea held the highest market share in 2019 at 45%, perhaps because of it being the traditional tea used in the drink or because of its distinct taste. Green tea is expected to experience the fastest growth through 2027 as more people become aware of green tea’s health benefits, such as lowering blood pressure and cholesterol and decreasing the risk of certain cancers. However, boba may not be the best way to enjoy the health benefits of green tea. While the average 8-ounce boba contains just 120 calories with little to no fat, it also has 28 grams of sugar, and that’s not taking into consideration that some varieties of boba are made with pudding, yogurt, fruit, jellies, and syrups. Consumption of high levels of sugar increases one’s risk for obesity and diabetes.

Fruit-flavored boba held 37% of the market, the highest share in 2019, followed by classic and coffee flavors. Fruit-flavored boba is expected to maintain its lead through 2027 owing to shops offering a wide range of flavors such as strawberry, passionfruit, honeydew, avocado, coconut, and lychee among others to satisfy a wide range of tastes. Coffee is expected to be the fastest-growing flavor over this time period due to coffee’s popularity as a healthy energy drink especially in Europe and Scandanavia. 

Not surprisingly, the Asia Pacific region is the largest market with a more than 35% share, Thailand being one of the major consumers. The average consumption in this country is six cups per person per month. Europe is expected to experience the highest growth through 2027 with the United Kingdom, Germany, and Italy being some of the countries with the highest demand in the region. North America is also expected to experience steady growth during this time period.2 Major companies are focused on expanding their presence globally and to gain market advantage are launching new flavor and tea varieties. Major suppliers in this industry include Bobabox Ltd., Bubble Tea House Co., Bubble Tea Supply Inc., Fokus Inc., Lollicup USA Inc., and Troika JC Inc. Leading bubble tea shop franchises include Gong Cha, ChaTime, T BUN International, and Ten Ren’s Tea Time.

1 According to Leslie Nguyen-Okwu, a journalist based in Taipei, Taiwan, although there are differing accounts as to who exactly invented boba, “[t]he one thing that everybody agrees upon is that the name “boba” is a reference to the 1980s Hong Kong sex symbol Amy Yip, whose nickname, ‘Boba,’ is also a Chinese slang term for her most famous pair of physical assets.”
2 A surge in demand for products assembled abroad and a shortage of workers due to coronavirus cases and public health protocols have created problems in the global supply chain in 2021, leaving dozens of ships delivering goods from Asia waiting out to sea. This created a shortage of boba in the United States and Canada in the first half of the year. Fully formed boba comes from Taiwan and cassava root, which is used to make tapioca, comes from Taiwan and islands in the Pacific Ocean. Low supply has led to supplier rationing and some shops had already run out of boba by April. As Brian Tran, co-owner of Honeybear Boba in San Francisco states: “A boba shop without boba is…like a steakhouse without steak.” While some customers may leave without buying anything, it may be an opportunity for others to try new toppings in their tea. Supplies weren’t expected to return to normal until the summer. Source: Kellen Browning, “Another Unlikely Pandemic Shortage: Boba Tea,” The New York Times, April 16, 2021 available online here.

Sources: “Bubble Tea Market Size, Share & Trends Analysis Report by Product (Black, Green, Oolong), by Flavor (Classic, Coffee, Fruit), by Region (APAC, North America, Europe, MEA), and Segment Forecasts, 2020 – 2027,” Grand View Research Report Summary, June 2020 available online here; “Bubble Tea Market Size Worth $4.2 Billion by 2027 | CAGR 8.9%: Grand View Research, Inc.,” CISION PRNewswire, June 11, 2020 available online here; Leslie Nguyen-Okwu, “Boba Explained: Types of Bubble Tea, and How to Order,” Eater, March 16, 2019 available online here; “National Tea Day — April 21, 2021,” National Today available online here; “Boba Tea: Are There Health Benefits?” WebMD available online here; “Bubble Tea,” Wikipedia, February 26, 2021 available online here; Kellen Browning, “Another Unlikely Pandemic Shortage: Boba Tea,” The New York Times, April 16, 2021 available online here.
Image source: Hiroaki Kaneda, “boba-pearl-milk-tea-boba-milk-tea-4402053,” Pixabay, August 13, 2019 available online here.

Kombucha

kombucha
Geographic reference: World
Year: 2019 and 2027
Market size: $1.67 billion and $7.05 billion, respectively
Sources: “Kombucha Market Size, Share & Trends Analysis Report by Flavor (Original, Flavored), by Distribution Channel (Supermarkets, Health Stores, Online Stores), by Region, and Segment Forecasts, 2020 – 2027,” Grand View Research Report Summary, February 2020 available online here; “Kombucha Market Size Worth $7.05 Billion by 2027 | CAGR: 19.7%: Grand View Research, Inc.,” CISION PR Newswire, February 10, 2020 available online here; “Kombucha,” Wikipedia, May 24, 2020 available online here; “Kombucha FAQ,” Kombucha Brewers International available online here; Laura Zhang, “The Cloudy Origins of Kombucha,” Smithsonian Center for Folklife and Cultural Heritage Magazine, April 15, 2019 available online here; “Sugary Drink Tax,” Wikipedia, May 27, 2020 available online here; “Obesity and Overweight: Key Facts,” World Health Organization, April 1, 2020 available online here; “10 Facts on Obesity,” World Health Organization, October 2017 available online here; Christina Troitino, “Kombucha 101: Demystifying The Past, Present And Future Of The Fermented Tea Drink,” Forbes, February 1, 2017 available online here; “#68 Kombucha: Tea of Immortality,” Food Non-Fiction, June 18, 2018 available online here.
Image source: Tim-Oliver Metz, “Close Up Shot of a Kombucha Fermenting,” Unsplash, March 5, 2020 available online here.

Kombucha is a fizzy, sweet-and-sour, fermented beverage made from tea leaves, sugar, Symbiotic Colony of Bacteria and Yeast (SCOBY), and flavorings. Brewing this beverage involves first steeping tea leaves in hot sugar water. Then, once the sweetened tea is cooled, the leaves are removed and the SCOBY is added. The mixture is poured into a sterilized container with previously fermented kombucha. The container is then covered with a breathable fabric and left to ferment for 10 to 14 days at room temperature. After, the new SCOBY that has formed is removed along with some of the newly fermented tea. The remaining kombucha is strained and bottled for a second fermentation then refrigerated to slow the carbonation and fermentation processes.

Kombucha is thought to have originated in Manchuria, possibly as far back as 221 B.C. Ancient East Asian cultures drank kombucha as a health remedy. Practitioners of traditional Chinese medicine called it the “tea of immortality” or the “elixir of life.” The name “kombucha” may have derived from the combination of the name of a Korean doctor who brought the fermented tea to Japan to treat Emperor Inkyo’s digestive ailments, Dr. Kombu, and “cha”, the Japanese word for tea.

By the late 1800s, the drink was reportedly consumed in Russia and Ukraine. Demand increased in Europe in the mid-20th century. In the early 1990s, the beverage was popular with those with HIV and AIDS who believed that it would help their immune systems and increase their T-cells. Some doctors, however, warned that the beverage was dangerous. Homemade brews may contain aspergillus, a toxin-producing fungus. Pregnant women, the elderly, children, and those with compromised immune systems were discouraged from drinking it. In 1995 the U.S. Centers for Disease Control and Prevention issued a report linking the death of one woman and the illness of another from severe metabolic acidosis to their daily consumption of kombucha. Although not cited as a definitive cause, kombucha consumption declined thereafter. 

In the late 1990s, commercially bottled kombucha became available and by the early 2000s, kombucha was back in favor as those following low-carbohydrate diets searched for a healthy drink to replace sugary soda and juices. Kombucha’s popularity also rose as part of the larger probiotic food consumption trend. Probiotic foods contain bacteria which some studies show benefit digestion and improve the immune system. As consumers look for ways to eat healthier and boost their immune system during the COVID-19 pandemic, kombucha consumption is expected to increase even more.

Today’s market size shows global revenues for kombucha in 2019 and projected for 2027. To increase sales companies are investing in new product development and new flavors. They are also increasingly using social media influencers to market their products online. Online sales are expected to exceed $2.4 billion in 2027, or 34% of sales for that year. Supermarket sales claimed the largest share in 2019 due to easy accessibility. Most supermarkets also offer higher discounts and more promotional offers than smaller health food stores due to their ability to buy higher volumes of product. Supermarkets can also stock a greater variety of products.

Worldwide, flavored kombucha constituted nearly 75% of the market in 2019. Brewers are expected to increase their use of natural extracts and flavorings as well as increase their use of exotic flavorings through 2027, contributing to an expected compound annual growth rate (CAGR) of 21.8%. Sales of original flavored kombucha are expected to expand at a CAGR of 20% over this time period. 

North America held a 52% share of the global market. An increasing middle-class population and increasing demand for non-carbonated, low-calorie beverages are expected to contribute to higher sales through 2027. The popularity of sports and energy nutrition products among working professionals in Europe is expected to contribute to increased consumption in that region as is more product offerings from large companies such as PepsiCo, The Coca-Cola Co., and Starbucks Coffee Co. Worldwide, the obesity epidemic — obesity has tripled since 1975, contributing to 2.8 million deaths per year — and taxes on sugary beverages are also expected to drive revenue growth for kombucha beverages.

The global market is fragmented with many small and medium-sized companies producing kombucha. Some leading producers include GT’s Living Food, PepsiCo; Reed’s Inc., The Hain Celestial Co., KeVita Inc., Buchi Kombucha, LIVE Beverages, and RedBull.

Fruit Tea

fruit tea
“Some days ‘staying put’ might feel the same as Going Nowhere. Make a cup of tea, and wait for that feeling to pass.” — Vivian Swift, When Wanderers Cease to Roam: A Traveler’s Journal of Staying Put

Whether a steaming hot cup of tea on a cold winter’s night or a cold glass of iced tea on a hot summer’s afternoon, however people choose to enjoy this beverage a great many are doing just that. Worldwide tea consumption, 35.2 liters per capita in 2017, is second only to packaged water consumption. In 2018, revenues totaled $52.1 billion.

Today’s market size shows worldwide revenues for one type of tea, fruit tea, for 2019 and projected for 2027. Fruit flavored tea sales are a small fraction of overall tea sales and will continue to be in the near future; however, sales are expected to increase at a compound annual growth rate (CAGR) of 9.6% through 2027. Overall tea sales are expected to rise at a CAGR of 5.8% over most of this time period.

Growth in the fruit tea market is expected to be driven by a growing consumer preference for low caffeine beverages and fruit-infused products, especially among millennials and the health-conscious. As with other segments of the food and beverage industry that are seeing a rise in organic product sales, organic teas are gaining in popularity but they are still a small segment of the market. In 2019, conventional teas claimed more than 80% of sales. Easy accessibility and affordability are factors in conventional fruit teas maintaining their high market share.

Most people buy their tea offline. A majority of sales take place at supermarkets and discount stores. Specialty retailers and teahouses are gaining in popularity among consumers who want premium teas with unique flavors. While online sales have a small share of the market, they are expected to have the fastest growth through 2027, with a CAGR of 10.6%.

The Asia-Pacific region claimed more than 35% of the global market in 2019. China is the largest producer and consumer of fruit tea. Demand for fruit and floral-infused beverages has seen significant growth in that country in recent years. North America is expected to experience the fastest growth, a CAGR of 10.5%, from 2020 to 2027 due to shifting consumer preferences for healthier fruit-flavored beverages. The increasing popularity of ready-to-drink beverages is also expected to contribute to this growth. Leading global fruit tea manufacturers include Harney & Sons Fine Teas, R. Twining and Company Ltd., Tata Consumer Products, Hain Celestial, Unilever, The Bigelow Tea Co., Dilmah Ceylon Tea Co. PLC, Tiesta Tea, and Bettys & Taylors of Harrogate Ltd.

Geographic reference: World
Year: 2019 and 2027
Market size: $2.4 billion and $5.1 billion, respectively
Sources: “Fruit Tea Market Size, Share & Trends Analysis Report by Product (Conventional, Organic), by Distribution Channel (Offline, Online), by Region (North America, Europe, APAC, CSA, MEA), and Segment Forecasts, 2020 – 2027,” Grand View Research Report Summary, March 2020 available online here; “Fruit Tea Market Size Worth $5.1 Billion by 2027 | CAGR: 9.6%: Grand View Research, Inc.,” CISION PR Newswire, April 23, 2020 available online here; “Tea Market by Type (Green Tea, Black Tea, Oolong Tea, Fruit/Herbal Tea, and Others), Packaging (Plastic Containers, Loose Tea, Paperboards, Aluminum Tins, and Tea Bags), Distribution Channel (Supermarkets/Hypermarkets, Specialty Stores, Convenience Stores, Online Stores, and Others) and Application (Residential and Commercial): Global Opportunity Analysis and Industry Forecast, 2019-2026,” Allied Market Research Report Overview, December 2019 available online here; Dan Bolton, “Tea Consumption Second Only to Packaged Water,” Worldtea News, May 1, 2018 available online here; “Tea Quotes,” Goodreads available online here.
Image source: TerriC, “tea-cup-vintage-tea-cup-tea-cup-2107599,” Pixabay, March 1, 2017 available online here.

Decaffeinated Coffee

coffee
Does your morning routine include reaching for a cup of hot coffee? If so, you’re not alone. Worldwide, 2.25 billion cups of coffee are consumed each day.

Legend has it that coffee was discovered in Ethiopia in the 9th century. By the 15th century, coffee was being grown in Yemen. From there the coffee trade spread to the Arabian Peninsula, Persia, Egypt, Syria, and Turkey. The first known coffee shop opened in Constantinople around 1475. In the 1600s coffee houses opened in England, Austria, France, Germany, and Holland. Coffee came to America in the 18th century. In 1903, German merchant Ludwig Roselius and his co-workers invented the first commercially successful decaffeination process and patented it in 1906. Back then, benzene was used as a solvent to make decaffeinated coffee, however, that’s no longer the case as benzene has been classified as a carcinogen.

Currently, several methods are used to decaffeinate coffee. The direct method involves steaming unroasted coffee beans and then rinsing the beans in an organic solvent such as dichloromethane or ethyl acetate to extract the caffeine. This process is repeated several times until the caffeine content reaches the required standard. In the United States, 97% of the caffeine has to be removed. In the European Union, 99.9% has to be removed by volume in order for the coffee to be called decaffeinated.

In the indirect method, coffee beans are soaked in hot water for several hours, then the beans are removed from the water and either dichloromethane or ethyl acetate is used to extract the caffeine from the water. The caffeine is then extracted from the solvent. The same water is recycled through the process with new batches of beans until an equilibrium is reached where the beans and the water have a similar composition except for the caffeine so no coffee strength or flavorings are lost.

In the Supercritical CO2 process, unroasted coffee beans are steamed then added to a high-pressure container. A mixture of water and CO2 is circulated through the container. The caffeine dissolves into the CO2 while the compounds contributing to the flavor in the coffee remain in the bean. In a separate container, the caffeine is extracted from the CO2 and then the CO2 is recirculated to the high-pressure container.

The Swiss Water process uses Green Coffee Extract (GCE), a solution containing water-soluble components of green (unroasted) coffee except for the caffeine. The caffeine from the unroasted coffee beans is drawn to the GCE. Once the GCE is caffeine-rich, it’s filtered to remove the caffeine and reused to remove additional caffeine from the unroasted coffee beans.

The Triglyceride process involves soaking unroasted coffee beans in a hot water/coffee solution to draw the caffeine to the surface of the beans. The beans are then transferred to another container and immersed in coffee oils and left to soak. After several hours of exposure to high heat, the triglycerides in the oils extract the caffeine. The beans are separated from the oils and dried. Then, the caffeine is removed from the oils. The oils are reused to decaffeinate another batch of coffee beans.

Today’s market size shows the revenues for decaffeinated coffee in 2019 and projected for 2027. The decaffeinated market is a very small segment of the $424.7 billion global coffee market. Traditionally, decaffeinated coffee drinkers are older and/or have health conditions in which doctors recommend limiting caffeine intake. As populations age, the size of the decaffeinated coffee market is expected to grow. Growth is also expected to come from millennials who constitute more than 31% of the world’s population. Millennial coffee drinkers prefer organically and sustainably-grown, decaffeinated, and lightly roasted coffee beans. In the United States, 19% of decaffeinated coffee drinkers are millennials. Overall, demand for decaffeinated coffee is also expected to rise among health-conscious individuals who want to cut back or eliminate their caffeine consumption due to caffeine’s negative effects on health, including jitteriness, restlessness, insomnia, and elevated blood pressure. In a 2017 report by the National Coffee Association, 68% of consumers in the United States thought it was necessary to reduce their caffeine intake.

Arabica beans comprised the majority of the global decaf coffee market in 2019, followed by Robusta beans. Arabica beans have naturally less caffeine than other varieties and are regarded as providing a superior coffee flavor, aroma, and body. The natural fruity and sweet flavor makes coffee made with these beans suitable for drinking without added sweeteners. Robusta beans are more bitter but easier to tend on the farm and less expensive than Arabica beans. The lower cost is driving demand in this segment. This demand is expected to grow the fastest, at a compound annual growth rate of 8.1% through 2027.

In 2019, Europe was the largest market for decaffeinated coffee due to the popularity of coffee in the region along with consumers’ growing awareness of caffeine’s side effects. The Asia-Pacific region is expected to experience the fastest growth as health-consciousness and demand for other decaffeinated beverages rises. North America is the largest importing region, followed by Europe. Some leading global decaffeinated coffee processors include Swiss Water Decaffeinated Coffee Inc., LifeBoost Decaf, Cafe Don Pablo Colombia Supremo Decaf, No Fun Jo Decaf; Fresh Roasted; and Volcanica Coffee Costa Rica Tarrazu Decaf.

Geographic reference: World
Year: 2019 and 2027
Market size: $1.65 billion and $2.8 billion, respectively
Sources: “Decaffeinated Coffee Market Size, Share & Trends Analysis Report by Product (Roasted, Raw), by Bean Species (Arabica, Robusta), by Distribution Channel, by Region, and Segment Forecasts, 2020 – 2027,” Grand View Research Report Summary, April 2020 available online here; “Decaffeinated Coffee Market Size Worth $2.8 Billion by 2027 | CAGR: 7.0%: Grand View Research, Inc.,” CISION PR Newswire, April 15, 2020 available online here; “Decaffeination,” Wikipedia, April 17, 2020 available online here; “The Caffeine Fix: Coffee Consumption, History, Trends & Industry Statistics,” Much Needed, February 22, 2020, updated April 23, 2020 available online here; “Global Markets for Decaffeinated Coffee Brochure,” LMC International, April 2019 available online here; “Coffee Worldwide,” Statista available online here; Tasmin Grant, “Exploring Millennial Trends in Specialty Coffee,” Perfect Daily Grind, February 3, 2020 available online here; Lee J. Miller and Wei Lu, “Gen Z Is Set to Outnumber Millennials Within a Year, Bloomberg, August 20, 2018 available online here; “The History of Coffee,” National Coffee Association available online here; “10 Differences Between Robusta and Arabica Coffee,” The Roasters Pack, September 19, 2014 available online here.
Image source: emilie767, “smoky-mountains-coffee-nature-3021394,” Pixabay, December 19, 2017 available online here.

Tea

tea

Worldwide, tea is the second-most consumed nonalcoholic beverage behind packaged water.1 Per capita consumption totaled 35.2 liters in 2017. According to legend, tea was discovered in China in 2737 B.C. by the emperor when leaves from a wild tree blew into a pot of boiling water. He named the drink “ch’a”, which means “to investigate”, to describe the warm feeling he felt when drinking this new beverage as if the liquid was investigating every part of his body. In 200 B.C. the emperor of China at that time ruled that a special written character be used when mentioning tea. The character consisting of wooden branches, grass and a man between the two was meant to symbolize tea bringing nature and humankind into balance in the Chinese culture.

Starting in the 8th century, trade with China introduced this drink to other parts of the world. It is now an important part of the culture in countries such as Japan, the United Kingdom, and Turkey in addition to China. In 2016, Turkey ranked number one in per capita consumption in the world, 6.96 pounds, followed by Ireland (4.83 lbs.), the United Kingdom (4.28 lbs.), Russia (3.05 lbs.), and Morocco (2.68 lbs.). Although the United States ranked 34th in per capita consumption in 2016, tea played an important role in its early history. To capitalize on its popularity in the American colonies, Britain, which exported tea to the colonies, imposed a tea tax. The tax eventually reached 119% of the original price at wholesale. The Boston Tea Party, one of the events that led to the American War of Independence, was a protest against this high taxation.

Today’s market size shows worldwide revenues for tea in 2018 and projected for 2026. In 2017, the last year for which data exists, China was the top producer of tea, followed by India, Kenya, Sri Lanka, and Viet Nam. Black and green are the most popular types globally, commanding 39.2% and 30.5% of the market, respectively. In the United States, sales totaled $19.7 billion in fiscal year 2018, according to Beverage Marketing Corporation. Black tea accounted for 84% of the tea consumed; green tea, 15%. Ready-to-drink tea was the only category to see an increase in both sales volume and value from 2017 to 2018. Ready-to-drink tea represents 46% of the U.S. market by volume, followed by teabags at 44%. Loose leaf tea, tea pods, and iced tea mix account for the rest. Major global manufacturers of tea include Tata Global Beverages, Unilever, Associated British Foods Plc., TAETEA, Barry’s Tea, Apeejay Surrendra Group, Bettys & Taylors Group Ltd., McLeod Russel, ITO EN Inc., and Mighty Leaf Tea Company, among others.

Sales are expected to grow through 2026 due to rising disposable income in many countries and consumers’ growing preferences for organic products and healthier beverages. Some sources claim that the polyphenols in tea, which have anti-inflammatory and antioxidant properties, can lower the risk of type 2 diabetes and cardiovascular disease. Others claim tea can boost one’s immune system, strengthen bones and teeth, reduce the risk of cancer and kidney stones and control blood cholesterol levels. According to Qi Sun, assistant professor in the Department of Nutrition at the Harvard School of Public Health, “Tea consumption, especially green tea, may not be the magic bullet, but it can be incorporated in an overall healthy diet with whole grains, fish, fruits and vegetables, and less red and processed meat.” Sun goes on to warn, however, that any health benefits of tea will likely be negated if one chooses to drink only processed, sugar-sweetened tea beverages.

January is National Hot Tea Month in the United States. May our readers have time to brew a cup, slow down, and savor life’s beautiful moments!

1 Does not include tap water.

Geographic reference: World
Year: 2018 and 2026
Market size: $52.1 billion and 81.6 billion, respectively
Sources: Sumesh Kumar and Roshan Deshmukh, “Tea Market by Type (Green Tea, Black Tea, Oolong Tea, Fruit/Herbal Tea, and Others), Packaging (Plastic Containers, Loose Tea, Paperboards, Aluminum Tins, and Tea Bags), Distribution Channel (Supermarkets/Hypermarkets, Specialty Stores, Convenience Stores, Online Stores, And Others) and Application (Residential and Commercial): Global Opportunity Analysis and Industry Forecast, 2019-2026,” Allied Market Research Report Summary, December 2019 available online here; “The History of Tea,” Coffee Tea Warehouse available online here; “List of Countries by Tea Consumption Per Capita,” Wikipedia, November 13, 2019 available online here; “Crops,” Food and Agriculture Organization of the United Nations, January 18, 2019 available online here; Dan Bolton, “Tea Consumption Second Only to Packaged Water,” World Tea News, May 1, 2018 available online here; Dan Bolton, “RTD Leads Growth in US Tea Market,” World Tea News, December 17, 2018 available online here; “Tea Market Size, Share & Trends Analysis Report by Product (Black, Green, Oolong, Herbal), by Distribution Channel (Supermarkets & Hypermarkets, Specialty Stores, Online), by Region, and Segment Forecasts, 2019 – 2025,” Grand View Research Report Summary, August 2019 available online here; “Tea Fact Sheet – 2018-2019,” Tea Association of the U.S.A. Inc. available online here; “Tea: A Cup of Good Health?” Harvard Men’s Health Watch, August 2014 available online here.
Image source: TerriC, “tea-cup-vintage-tea-cup-tea-cup-2107599,” Pixabay, March 1, 2017 available online here.

Coffee Cafes

Coffee cafe
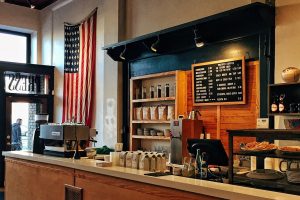
According to the National Coffee Association’s 2017 National Coffee Drinking Trends report, 62% of Americans drink coffee on a daily basis and 46% of coffee consumed is done so away from home. Although the recent popularity of coffee cafes may be traced back to the 1990s when Starbucks expanded across the country, TV show friends were seen hanging out at Central Perk coffeehouse, and laptops and wi-fi allowed workers to work from anywhere, coffee cafes are nothing new. The first public place to serve coffee dates back to 1475 in Constantinople, Turkey (now Istanbul).

Today’s market size shows the total sales of coffee cafe chains in the United States in 2016. The top three coffee cafe chains, in terms of sales, are Starbucks (estimated $14.7 billion, accounting for nearly 60% of the total sales at coffee cafe chains in the U.S.), Dunkin’ Donuts ($8.2 billion), and Tim Hortons (estimated $760 million).

Geographic reference: United States
Year: 2016
Market size: $24.8 billion (a 9.7% increase from 2015)
Sources: “Coffee Cafe,” Restaurant Business, June 2017, page 55 available online here; Paajanen, Sean, “The Evolution of the Coffee House,” The Spruce, November 27, 2016 available online here; Mock, Brentin, “What Made Coffeehouse Culture Go Boom?” CityLab, January 23, 2017 available online here; Auffermann, Kyra, “From Brew Boomers to the Gourmet Generation: National Coffee Drinking Trends 2017,” The First Pull, National Coffee Association, March 28, 2017 available online here; DeRupo, Joe, “Daily Coffee Consumption Up Sharply,” National Coffee Association News Release, March 25, 2017 available online here.
Original source: Technomic’s Top 500 Chain Restaurant Report
Image source: Free-Photos, “coffee-shop-american-flag-america-1081713,” Pixabay, January 7, 2016 available online here.

Office Coffee Service

The market for office coffee service—this service, often abbreviated OCS, provides companies with the hardware and consumables needed to supply their employees and guests with hot beverages, usually coffee—declined during the recession of 2007-2009 but began to grow again in 2011. This turnaround occurred more quickly than did the rebound for the larger vending machine contractors industry generally. Credit is given by the industry to its ability to be flexible and to alter its offerings. In particular, the rising popularity of single-cup systems has helped the industry to weather economic cycles throughout the first decade of the 2000s.

Today’s market size is the value of the office coffee service market in 2011, a figure that was forecast to rise by 3.5% in both of the following two years.

Geographic reference: United States
Year: 2011
Market size: $4 billion
Source: “Report: Office Coffee Sales To Increase 3.5 Percent Annually in 2012 and 2013,” February 21, 2012, Vending Marketwatch, available online here.
Original source: Packaged Facts
Posted on January 10, 2013

Coffee

Today’s market size offers a measure of the world’s coffee production. The U.S. Department of Agriculture tracks many, many agricultural products, geographically, by output, by shipment and even by consumption. Another example of how the Federal government’s data collection agencies provide us with an extremely valuable service.

Happy tax day!

Geographic reference: World
Year: 2000-2001 and 2010-2011
Market size: 117,521 and 139,084 thousand 60-kilogram bags respectively
Source: “Table 01 – Coffee World Production, Supply and Distribution,” Coffee: World
Markets and Trade,
December 2010, page 4, available online here.
Original source: U.S. Department of Agriculture, Foreign Agricultural Service

Coffee in Puerto Rico

Puerto Rico is experiencing a decline in its coffee production. Over the period from 2002 to 2009 the island saw a decline of more than half in the number of farms growing coffee beans, from 9,000 in 2002 to 4,000 on 2009. According to the source article, the reasons for this decline are varied and include flooding from recent tropical storms as well as difficulty finding enough workers to pick the coffee beans at harvest time. Despite high unemployment rates an estimated $25 million worth of coffee was left unpicked in the 2009-2010 season, according to the Puerto Rico Coffee Buyers & Growers Association.

Geographic reference: Puerto Rico
Year: 2006 and 2010
Market size: 178,000 pounds and 80,000 pounds respectively. The harvest in 2010 had an estimated value of $23 million.
Source: “Sharp Drop in Coffee Production on Puerto Rico Worries Growers,” The Avis, February 19, 2011, St. Croix, Virgin Islands.
Original source: Puerto Rico Coffee Buyers & Growers Association.