Resorcinol

Resorcinol is used in tire manufacturing.
Geographic reference: World
Year: 2020 and 2028
Market size: $500 million and $623.63 million, respectively

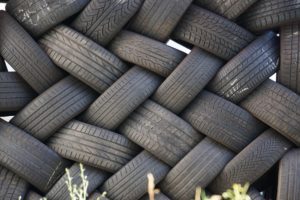
Today’s market size shows total global revenues for resorcinol in 2020 and projected for 2028. Resorcinol is an organic compound, a 1,3-isomer of benzenediol, with the molecular formula C6H6O2. It’s used in a variety of products from dermatologic medications to treat acne, eczema, and other skin disorders to flame retardants, adhesives, hair dyes, and cosmetics. It’s also used in tire manufacturing. In 2019, rubber products accounted for 50.7% of global consumption. This compound is used for fusing natural and synthetic rubber to steel, nylon, polyester, aramid, glass, and rayon fibers. Other end-uses in descending order of market size include ultraviolet stabilization, wood adhesives, flame retardants, and others.

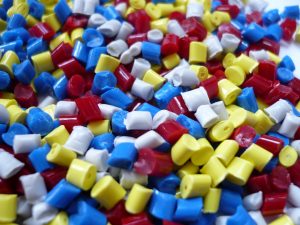
Rising disposable income in many parts of the world is contributing to higher demand for passenger vehicles, which in turn is contributing to the demand for tires and the resorcinol used in manufacturing them. A study published in May 2021 by Global Industry Analysts Inc. predicts the global tire market will reach 2.9 billion units in 2027, up from 2.1 billion units in 2020. Increasing demand for electronics and electrical products is also contributing to growth in the resorcinol market. This chemical is used in flame retardants in these products. A third factor fueling growth is the increasing demand for light screening chemicals to protect plastics from ultraviolet rays.

The Asia-Pacific region had the highest market share by far in 2019 with about double the revenue of North America, the region with the second-highest share. Europe ranked third. By 2027, Asia-Pacific’s share of the market is expected to be more than triple that of North America, as demand in this region is expected to grow the fastest. Tires dominated the end-use for resorcinol in the Asia-Pacific region, especially in India, China, and Japan. In addition, the high demand for medications to treat skin ailments contributed to this high revenue share. Resorcinol is primarily used in adhesives for tires and wood products in North America. Growth in this region will come from the increasing demand for specialty adhesives in the military, aerospace, tooling, and automotive sectors. In Europe, demand is driven by the pharmaceutical companies that develop topical medications to treat skin disorders and infections. By country, China and the United States ranked first and second, respectively, in the consumption of resorcinol. In China, about 25% of resorcinol is used to make ultraviolet stabilizers. Sumitomo Chemical Advanced Technologies is the largest resorcinol producer in the world. Other major producers include Alfa Aesar, Dynea AS, Kraeber & Co. GmbH, Atul Ltd., Jiangsu Zhongdan Chemical Group Corp., Akrochem Corp., Euram Chemicals Ltd., and MilliporeSigma. 

Sources: “Resorcinol Market Size to Reach USD 623.63 Million in 2028 from USD 500.0 Million in 2020, with Offline Leading Among the Distribution Channel Segments: Reports and Data,” CISION PR Newswire, August 26, 2021 available online here; “Resorcinol Market Size, Share and Industry Analysis by Production Method (Benzene Sulfonation, Meta-Diisopropylbenzene Preoxidation), by Distribution Channel (Online, Offline), by Application (Rubber Products, UV Stabilization, Wood Adhesives, Flame Retardants, Others) and Region, Segment Forecasts to 2028,” Reports and Data Report Description, April 2020 available online here; “PubChem Compound Summary for CID 5054, Resorcinol,” PubChem, National Center for Biotechnology Information available online here; “Tires: Global Market Trajectory & Analytics,” StrategyR Highlights & Report Index, May 2021 available online here; “Resorcinol,” Sumitomo Chemical Advanced Technologies available online here.
Image source: erikmi, “car-tire-black-stacked-automobile-2413943,” Pixabay, June 17, 2017 available online here.

High Purity Alumina

LED bulb, high purity alumina, synthetic sapphire.
High purity alumina is used in the production of synthetic sapphire which is used in the manufacture of substrates for LED lights.
Geographic reference: World
Year: 2018, 2020, and 2025
Market size: $1.83 billion, $1.8 billion, and $6.68 billion, respectively

Today’s market size shows the total global revenues for high purity alumina (HPA) in 2018, 2020, and projected for 2025.1 HPA is a high purity form of aluminum oxide (Al2O3). It is an essential ingredient in the production of synthetic sapphire. Synthetic sapphire is used in the manufacture of substrates for LED lights, semiconductor wafers, and scratch-resistant sapphire glass for wristwatch faces, optical windows, and smartphones. HPA is also used to manufacture bio-medical devices such as pacemakers, intraocular cataract lenses, vascular grafts, orthopedic pins, and surgical tools. As a coating, it is used on the separator sheets in lithium-ion batteries.

In 2018, global demand reached 19,000 tons per annum (TPA). By some estimates, demand will reach 272,000 TPA in 2028. Growth in the HPA market will primarily be driven by demand for LED lighting and electric vehicles. In 2018, LED lighting garnered about half of the HPA market. Growth will come from government incentives for the installation of energy-efficient lighting, declining prices, consumer demand for environmentally-friendly lighting alternatives, and the increased usage of LED lighting in automotive manufacturing. In 2020, electric vehicles accounted for 4.2% of light vehicle sales worldwide, almost double the percentage in 2019. Thirteen countries saw electric vehicle sales of greater than 10% of all passenger cars sold. Thanks to tax exemptions, toll exemptions, and other incentives nearly 75% of all passenger car sales in Norway in 2020 were for electric vehicles. By unit sales, China led with 1.3 million plug-in electric vehicles sold in 2020, a 15% jump from the year before. Some countries such as Germany, France, and the United Kingdom had triple-digit sales growth over this time. With battery costs dropping 90% over the last 10 years, more than 600 electric vehicle models launching by 2025, and governments worldwide mandating transitions to clean fleets by 2030 or 2050, the World Economic Forum predicts that by 2040, half of all new vehicles sold will be electric.

HPA comes in three grades. 4N is 99.99% pure. It’s commonly used in LEDs, energy storage capacitors, lithium-ion batteries, and decorative and bright finishes. In 2018, this grade of HPA constituted about 64% of sales.2 5N is 99.999% pure and is used in liquid crystal displays and in thin-film applications in the semiconductor industry. Because of its scratch resistance, chemical stability, and extreme hardness, it, along with 4N, is used in synthetic sapphire production. 6N is 99.9999% pure and is the most expensive grade of HPA. It’s used in semiconductors, solid-state lasers, sensors, abrasives, alumina ceramics, and separator membranes. 6N is expected to see significant growth as demand increases from the aerospace and defense, automotive, health care, and electronics industries.

By region, the Asia-Pacific region had a 67.3% revenue share in 2018, with China, Japan, and Australia being the major markets. All have been expanding manufacturing capacity to meet the demand for LEDs, lithium-ion batteries, and smartphones at home and elsewhere. Europe and North America are each expected to experience a greater than 14% compound annual growth rate through 2025 as demand for lithium-ion batteries in Europe and LEDs in both regions grows significantly. There are a small number of major producers operating globally. These include Sumitomo Chemical Co. Ltd., Sasol Ltd., Baikowski SAS, Hebei Heng Bo New Material Technology Co. Ltd., Nippon Light Metal Co. Ltd., Altech Chemicals Ltd., and Polar Sapphire Ltd.

1 Some sources predict much lower future revenues, in the $4.5 billion to $4.8 billion range for 2026-2027. The 2025 projection is from Grand View Research.
2 Source: “High Purity Alumina Market,” Transparency Market Research Report Preview, April 26, 2018 available online here.

Sources: “High Purity Alumina Market Size, Share & Trend Analysis Report by Product (4N, 5N, 6N), by Application (LED, Semiconductor, Lithium-Ion Battery, Sapphire), by Region and Segment Forecasts, 2019 – 2025,” Grand View Research Report Summary, November 2019 available online here; “High Purity Alumina Market Size Worth $6.68 Billion by 2025: Grand View Research, Inc.,” CISION PR Newswire, February 20, 2020 available online here; Kiran Pulidindi and Akshay Prakash, “High Purity Alumina (HPA) Market Size, by Technology (Hydrolysis, HCl Leaching), by Product (4N, 5N, 6N), by Application (LEDs, Semiconductors, Phosphor, Sapphire), Industry Analysis Report, Regional Outlook, Growth Potential, Price Trends, Competitive Market Share & Forecast, 2021 – 2027,” Global Market Insights, February 2021 available online here; “High Purity Alumina Market,” Transparency Market Research Report Preview, April 26, 2018 available online here; Felix Richter, “Chart: Which Countries Have the Most Electric Cars?” World Economic Forum, February 19, 2021 available online here; Jonathan Eckart and Frank Muehlon, “Here’s How Electric Vehicles Can Keep Us on the Road to Paris,” World Economic Forum, September 11, 2020 available online here; Felix Richter, “Who Leads the Charge Towards Electric Mobility?” Statista, February 16, 2021 available online here; “High Purity Alumina (HPA),” Altech Chemicals Ltd. available online here; “Global High Purity Alumina Market (2020 to 2026) – by Type, Technology and Application – ResearchAndMarkets.com,” BusinessWire, October 15, 2020 available online here.
Image source: Federico Bottos, “Idea,” Unsplash, July 19, 2018 available online here.

Methanol

methanol fuel
Methanol is a toxic, colorless, flammable liquid. It used to be called wood alcohol because it’s a byproduct of the destructive distillation of wood, a process by which wood is heated to a high temperature in the absence of oxygen in order to extract various chemicals. Now it’s made using natural gas in a catalytic industrial process. Methanol can also be made from coal, biomass, landfill gas and power plant or industrial emissions. Methanol has been one of the most widely used industrial chemicals since the 1800s.

Today’s market size shows methanol revenues for 2018, 2020 and 2027.1 Data for 2027 is projected. According to the Methanol Institute, global demand for methanol increased at a compound annual growth rate of 5.9% from 2014 to 2019. Production takes place on 5 continents and in the Middle East. There are 90 plants with a combined production capacity of 110 million metric tons worldwide. Forty percent of the methanol consumed is used for emerging energy applications and about 33% is used in the production of formaldehyde. Formaldehyde is used in the production of resins, glues and various plastics. It’s also used to produce acetic acid which is used in the production of polyester fibers and PET plastics. The newest and growing use for methanol is in the production of light olefins ethylene and propylene. Ethylene is used in the production of packaging and nonpackaging film, PET plastics, PVC and polystyrene. Propylene is used as an alternative to propane and as a fuel gas in the chemical and plastics industries. Most methanol to light olefin production is done in China.

Emerging energy applications for methanol include automobile fuel, marine fuel, DME, biodiesel, fuel cells, electricity and boilers and cookstoves.2 China leads the world in using methanol as an automotive fuel. Currently, a majority of passenger cars in China are fueled by M15, a blend of 85% gasoline and 15% methanol. Since 2012 China has been participating in a pilot program to study the efficacy of using 100% methanol. In the last few years, 470,000 buses, trucks and taxis have been converted to run on either 100% methanol (M100) or a blend of 85% methanol and 15% gasoline (M85). In March 2019, China issued a policy paper encouraging the broad adoption of M100 as a vehicle fuel. Australia, Egypt, Iceland, and Israel also have programs testing the viability of using methanol as a transportation fuel. The United States researched using methanol as fuel in the 1980s and 1990s. Ford, GM, and Chrysler produced methanol-fueled versions of popular car models and sold them at the same price as gasoline-powered models. By 1997 there were 15,000 methanol-fueled vehicles on the road with 100 fueling stations in California alone. But, once the price of gasoline dropped below the price of methanol, the automakers stopped producing methanol-fueled vehicles. Despite this, with more than 200 million miles driven, methanol-fueled vehicles proved to be a viable alternative to gasoline-powered vehicles.

Why methanol? Renewable methanol, made from agricultural waste, forestry residues, municipal solid waste, and carbon dioxide from industrial exhaust, lowers carbon emissions by 65-95% when compared to fossil fuels. According to the Danish Department of Energy, carbon dioxide emissions from methanol on a well-to-wheel basis are the lowest of all alternative fuels, including battery-electric. Carbon dioxide emissions totaled 176g/km for gasoline engines, 178g/km for hydrogen, 142g/km for hybrid engines, 132g/km for diesel, 98g/km for battery-electric, and 83g/km for methanol. Renewable methanol fuel also has lower emissions of nitrogen oxides and volatile organic compounds and contains no benzene, toluene, ethylbenzene, and xylene. These last four cancer-causing chemicals in gasoline emissions do not biodegrade easily and can contaminate groundwater. And, while methanol emissions do contain toxic formaldehyde, if a heated catalytic converter is used, the levels meet or exceed California’s strict Ultra Low Emission Vehicle emission targets. With ground transportation accounting for close to 73% of all transportation greenhouse gas emissions in Europe alone in 2015, widespread adoption of methanol-fueled vehicles can have a dramatic effect on lowering carbon emissions and reducing the effects of climate change.

In 2019, three regions of the world accounted for approximately 75% of methanol consumption globally. More than half of global consumption was in China, followed by Eastern Europe and the United States. The industry is fragmented with the top 10 companies having less than 30% of global capacity. The leading producer of methanol is Methanex. Other top companies include SABIC, Celanese Corp., Eastman Chemical Co., BASF SE, and Atlantic Methanol among others. Methanex, SABIC, QAFAC, and GPIC produce low carbon methanol. BASF, BioMCN, Enerkem, New Fuel, and Nordic Green produce bio-methanol. Renewable methanol is produced by Carbon Recycling International and Innogy. More than 30 companies are involved in the research and development of low carbon methanol, bio-methanol, and renewable methanol.

1 Source for 2018 and 2027 data: “The Global Methanol Market to Garner $56,151 Million by 2027,” AB Newswire Press Release, March 17, 2020 available online here. Source for 2020 data: “Global Methanol Market 2020 : Industry Outlook, Top Countries Data, Comprehensive Insights, Growth and Forecast 2026,” MarketWatch Press Release, February 5, 2020 available online here.
2 DME stands for dimethyl ether. It’s used as a replacement for propane in liquid petroleum gas and can be used as a replacement for diesel fuel in transportation.

Geographic reference: World
Year: 2018, 2020 and 2027
Market size: $34.5 billion, $36.85 billion and $56.2 billion, respectively
Sources: “The Global Methanol Market to Garner $56,151 Million by 2027,” AB Newswire Press Release, March 17, 2020 available online here; “Global Methanol Market 2020 : Industry Outlook, Top Countries Data, Comprehensive Insights, Growth and Forecast 2026,” MarketWatch Press Release, February 5, 2020 available online here; “Energy,” Methanol Institute available online here; “The Methanol Industry,” Methanol Institute available online here; Tammy Klein, Methanol: A Future-Proof Fuel, Methanol Institute, February 2020 available online here; “The Chemical,” Methanol Institute available online here; “Methanol,” Chemical Economics Handbook, December 2019, IHS Markit press release available online here; Renewable Methanol Report, ATA Markets Intelligence S.L. on behalf of the Methanol Institute, December 2018 available online here; “Methanol Fuel in the Environment,” Methanol Fuels available online here; “Ethylene Uses and Market Data,” Independent Commodity Intelligence Services, December 9, 2010 available online here; “Methanol Market Size, Share, Demand, Trends, Industry Analysis, Statistics Worldwide 2026 | BASF SE, SABIC, Eastman,” MarketWatch Press Release, March 5, 2020 available online here; “Propylene,” Industrial Gases available online here.
Image source: Paul Brennan, “pumping-gas-fuel-pump-industry-gas-1631634,” Pixabay, August 31, 2016 available online here.

Polyaryletherketone

Plastic polymer granules

Polyaryletherketone, or PAEK, is a group of thermoplastics that is strong, flexible, and durable. These thermoplastics are resistant to corrosion and do not break down when sterilized. They can be machined and are versatile for many applications in the oil and gas, electrical and electronics, aerospace, automotive and medical industries. Seals, valves, and bearings for oil drilling; surgical implants; chemical pumps; and automotive gears are some of the applications for various forms of PAEK.

Three types of PAEK thermoplastics are polyetheretherketone (PEEK), polyetherketone (PEK), and polyetherketoneketone (PEKK). PEEK thermoplastics are used as a replacement for metal in high temperature and high wear applications. Depending on the use, glass or carbon fillers are added to PEEK to increase its strength and thermal stability. Unfilled PEEK has low smoke and toxic gas emissions when burned. As a result, it’s often used in airplane interiors. PEEK is also used to manufacture items such as bearings, piston parts, and electrical cable insulation. Increasingly, it’s being used for spinal fusion devices and reinforcing rods.

PEK thermoplastics are used for components that need to retain their strength when exposed to high temperatures over long periods. Gears, shafts, bushes, bearings, and miniature rotational precision parts in the aerospace and automotive industries are some of the end uses for PEK.

PEKK, like PEEK, lends itself to uses in 3D printing applications. However, PEKK has 80% more compression strength than PEEK and is naturally antibacterial. Because of its antibacterial properties, its osteoconductivity properties allowing for bone growth and its radiolucent properties compatible with MRI machines, this material is used in patient-specific 3D-printed implants. Oxford Performance Materials, Inc. received U.S. Food and Drug Administration approval for its PEKK cranial and fascial implants in 2013 and 2014, respectively. In 2019, this company obtained a license to sell its PEKK implants in various countries throughout Asia. PEKK, like other PAEK thermoplastics, is used in end-market industrial components also.

Today’s market size shows the expected total global revenue for PAEK thermoplastics in 2019 and 2024. In 2018, PEEK had the highest market share. Demand for PEEK is expected to increase during this time due to increased demand from the oil and gas, electrical and electronics and medical industries. Worldwide, the APAC region is projected to have the highest market share, 41%, followed by North America (30%), and Europe (10%). Some leading providers of PAEK products include Victrex PLC, Solvay, Evonik Industries AG, Arkema SA, Celanese Corporation, Gharda Chemicals Ltd., and Panjin Zhongrun High-Performance Polymers Co. Ltd.

Geographic reference: World
Year: 2019 and 2024
Market size: $851 million and $1.15 billion, respectively
Sources: “The PAEK Market Size is Expected to Grow from USD 851 Million in 2019 to USD 1,149 Million by 2024, at a CAGR of 6.2%,” Olean Times Herald, October 23, 2019 available online here; “PAEK Market by Type (PEK, PEEK, PEKK), Fillers (Glass Filled, Carbon Filled, Unfilled), Application (Oil & Gas, Electricals & Electronics, Automotive, Medical, Aerospace), Region (APAC, Europe, North America, South America, MEA) – Global Forecast to 2024,” Marketresearch.com Report Description, October 2019 available online here; “Polyaryletherketone,” Wikipedia, November 25, 2017 available online here; Andy Pye, “Operating at PAEK Performance: An Overview of Polyaryletherketones,” Prospector, February 10, 2017 available online here; “PEEK (Polyetheretherketone),” Performance Plastics available online here; “PEEK vs. PEK vs. PTFE,” Greene Tweed available online here; Marco, “All You Need to Know About PEKK,” 3devo, June 28, 2017 available online here; Daphne Allen, “3D Printer of PEKK Implants Expanding in Asia,” MD+DI, July 20, 2018 available online here.
Image source: feiern1, “plastic-polymer-granules-1061731,” Pixabay, November 25, 2015 available online here. Picture is of plastic polymer granules, not PAEK thermoplastic granules.

Optical Coatings

sunglasses with optical coatings

Your bathroom mirror. Your eyeglasses with anti-reflective lenses. Your polarized sunglasses that block UV light. Your smartphone. All of these everyday items contain optical coatings. Optical coatings are thin layers of material deposited on optical components that alter the way the components reflect and transmit light. The consumer electronics, solar, medical, architecture, aerospace and defense, automotive, and telecommunications industries all use products containing optical coatings.

Types of optical coatings include high refractive index coatings, anti-reflective coatings, high reflective coatings, optical filter coatings, and transparent conductive coatings. High refractive index coatings are used to coat the surface of a light-emitting device so that light can travel more efficiently into or out of the device. This leads to better picture quality. This type of coating is used on semiconductor image sensors, LEDs and OLEDs used in emissive display devices such as smartphones, tablets, laptops, and televisions. Anti-reflective coatings are layered transparent thin films most often used to coat lenses in order to reduce reflection. On lenses for eyeglasses, microscopes or telescopes, the elimination of stray light from reflections improves the clarity of the image seen through the lenses. Some consumers also prefer anti-reflective eyeglass lenses because they eliminate glare so that the lenses themselves are less visible. High reflective coatings are metal or metal oxide-based coatings used in mirrors or mirrored surfaces. Because these coatings reflect heat as well as light, they’re also used on building surfaces, for heat dissipation in electronics and for cooling solar cells. Optical filter coatings selectively filter out certain wavelengths of light while allowing other wavelengths through. A common example is UV filtering sunglasses. Transparent conductive coatings are transparent thin films that conduct electricity. They’re used in touch screen displays and as electrodes for LEDs and thin film solar cells.

Today’s market size shows the total global revenue from optical coatings in 2017 and projected for 2026. In 2017, the highest revenue share came from anti-reflective coatings. Increasing demand for use in eyewear, binoculars, kiosk displays, and video games is expected to fuel growth in this sector. Filter coating demand is expected to grow due to its use in automotive night vision, flame and gas detection, thermal imaging and thermography. Several leading companies that manufacture optical coatings include Alluxa, Cascade Optical Corp., Chroma Technology Corp., Inrad Optics, and Optical Coatings Japan among others.

Geographic reference: World
Year: 2017 and 2026
Market size: $12.8 billion and $25.7 billion, respectively
Sources: “Optical Coatings Market Size Worth USD 25.7 Billion by 2026: Acumen Research and Consulting,” GlobeNewswire Press Release, March 18, 2019 available online here; “Optical Coating,” Wikipedia, October 24, 2018 available online here; “High-Refractive-Index Polymer,” Wikipedia, March 15, 2019 available online here; “Anti-Reflective Coating,” Wikipedia, April 7, 2019 available online here; “Encyclopedia,” PCMag.com available online here; Theresa Hendrick, “5 Powerful Trends in High Performance Optical Coatings with Advanced Materials,” Cerion Advanced Materials, October 2018 available online here; “Optical Filter,” Wikipedia, March 9, 2019 available online here; “Transparent Conducting Film,” Wikipedia, March 12, 2019 available online here.
Image source: Andreas Lischka, “sunglasses-sand-beach-sun-2523803,” Pixabay, July 20, 2017 available online here.

E-Cigarettes

e-cigaretteElectronic cigarettes, or e-cigarettes, are devices designed to release nicotine vapor without actually burning tobacco, thus, without smoke. They are battery operated devices which, in many cases, look like cigarettes but use a battery to produce heat which then atomizes the nicotine in a specially made cartridge. The liquid in the cartridge may contain flavorings such as cherry, mint, or cotton candy to name a few. Vaporizers are similar to e-cigarettes, except that instead of a disposable cartridge, the liquid is stored in either a refillable tank or a prefilled capsule.

E-cigarettes were first sold in 2007. By 2016, 35 million people worldwide vaped, a five-fold increase from 2011. According to a report in the Annals of Internal Medicine, 10.8 million people in the United States vape. In contrast, the number of tobacco smokers worldwide numbered 1.11 billion in 2016 and in the United States, 37.8 million. These numbers aren’t exclusive. Researchers found that in the United States many users both vape and smoke traditional cigarettes.

While overall youth tobacco use dropped 20% from 2011 to 2017, e-cigarette use among high school students in the U.S. increased 900% from 2011 to 2015, according to the Centers for Disease Control and Prevention. In response, on September 12, 2018, the Food and Drug Administration (FDA) gave several e-cigarette product manufacturers 60 days to formulate plans to reduce the use of their products by minors or have their products removed from the market. FDA Commissioner Scott Gottlieb stated “e-cigarettes may present an important opportunity for adult smokers to transition off combustible tobacco products. But these public health opportunities are put at risk if all we do is hook another generation of kids on nicotine and tobacco products through alternatives like e-cigarettes.”

In November, a week before the deadline imposed in September, the FDA announced it would ban convenience store and gas station sales of all flavors of e-cigarette liquids except for tobacco, mint, and menthol. The Family Smoking Prevention and Tobacco Control Act that was signed into law in 2009 prohibits any restrictions to “the sale of any tobacco product in face-to-face transactions by a specific category of retail outlets.”1 As a result, lawsuits seeking to block the ban were predicted. A few days after the FDA announcement, Juul Labs announced a halt to all sales of its flavored e-cigarette liquid2 at brick-and-mortar stores throughout the United States, more than 19,000 locations, including those locations not a part of the FDA ban.

Today’s market size shows e-cigarette sales in the 52 weeks ended June 16, 2018, in the United States.3 In terms of dollar sales during the 4 weeks ended October 6, 2018, Juul Labs led with a 75% market share, followed by British American Tobacco (10%), Altria Group (6%) and Imperial Tobacco (6%). All other e-cigarette makers combined had a 5% share of the market. Globally, the market for e-cigarettes and related products is estimated to be worth $22.6 billion, up from $4.2 billion five years ago.

1 Family Smoking Prevention and Tobacco Control Act, Public Law 111-31, Sec. 906.d.3.A.i
2 Mango, cucumber, creme and fruit flavors.
3 Original source of data: Nielsen. Nielsen tracks sales at mass merchandisers and convenience stores.

Geographic reference: United States
Year: 2018
Market size: $1.96 billion
Sources: Angelica LaVito, “Popular E-Cigarette Juul’s Sales Have Surged Almost 800 Percent Over the Past Year,” CNBC, July 2, 2018, updated September 11, 2018 available online here; “Smoked Out,” The Economist, September 15, 2018, page 72; Teresa W Wang, et. al., “National and State-Specific Unit Sales and Prices for Electronic Cigarettes, United States, 2012-2016,” Centers for Disease Control and Prevention, August 2, 2018 available online here; Lisa Rapaport, “Almost One in 20 U.S. Adults Now Use E-Cigarettes,” Reuters, August 27, 2018 available online here; “Current Cigarette Smoking Among Adults in the United States,” Centers for Disease Control and Prevention, September 24, 2018 available online here; Lora Jones, “Vaping – The Rise in Five Charts,” BBC, May 31, 2018 available online here; WHO Global Report on Trends in Prevalence of Tobacco Smoking 2000-2025 – Second Edition, World Health Organization, 2018 available online here; Emilie Ikeda, “E-Cigarettes Ubiquitous at Schools Despite All Efforts: ‘You Won’t Find a Kid in Georgia Who Hasn’t Vaped Before,'” Fox News Channel, June 7, 2018 available online here; “Differences Between E-Cigs and Vaporizers” available online here; Jayne O’Donnell, “FDA to Limit Sale of Sweet-Flavored E-Cigarettes in Hope of Curbing Teen Vaping ‘Epidemic’,” Lansing State Journal, November 9, 2018, updated November 10, 2018 available online here; “Family Smoking Prevention and Tobacco Control Act Table of Contents,” U.S. Food and Drug Administration, January 7, 2018 available online here; Ashley Welch, “Juul to Halt Sales of Flavored E-Cigarettes in Retail Stores,” CBS News, November 13, 2018 available online here.
Original sources: Wells Fargo, Nielsen. Nielsen tracks sales at mass merchandisers and convenience stores.
Image source: Rolandmey, “e-cigarette-steam-evaporator-health-1881957,” Pixabay, December 5, 2016 available online here.

Polypropylene

Polypropylene recycling symbolPolypropylene is a thermoplastic polymer made from propylene monomers and catalysts. It was first polymerized in 1951 by Philips petroleum scientists Paul Hogan and Robert Banks. In 1954 Italian chemist Giulio Natta perfected and synthesized the first polypropylene resin. By 1957 it was in widespread commercial production across Europe. Currently, it is one of the most commonly produced plastics in the world.

Because polypropylene can be combined with other polymers, the types of end uses can vary widely making it a versatile material with which to work. In 2016 global demand was 45 million metric tons, 30% of which was used in the packaging industry. Some other uses include automotive parts, furniture, dishwasher-safe plates, toys, carpets, upholstery, laboratory equipment and medical devices.

Today’s market size shows the estimated global sales of polypropylene in 2017 and projected for 2022. Polypropylene homopolymers are expected to be the fastest-growing type during this time period due to increasing demand in the automotive and medical industries, especially in the Asia Pacific region. The market for polypropylene is expected to grow the fastest in China, followed by India and South Korea from 2017 to 2022.

Geographic reference: World
Year: 2017 estimated and 2022 projected
Market size: $75.40 billion and $99.17 billion respectively
Sources: “The Polypropylene Market Size is Estimated at USD 75.40 Billion and Projected to Reach USD 99.17 Billion by 2022, at a CAGR of 5.6% Between 2017 and 2022,” CISION PR Newswire Press Release, February 1, 2018 available online here; “Everything You Need to Know About Polypropylene (PP) Plastic,” Creative Mechanisms, 2016 available online here; and “Polypropylene,” Wikipedia, April 23, 2018 available online here.
Image source: OpenIcons,”recycle-5-pp-recycling-plastic-98858,” Pixabay, April 1, 2013 available online here.

Fatty Amides

Plastic food packagingFatty amides, organic compounds derived from fatty acids, are used as slip agents and anti-blocking agents in polyolefin film processing. They’re added to the polymer from which the film is made. When the film is pressed, the fatty amides come to the surface and decrease the coefficient of friction between the film and the machine rollers to aid in the processing of the film. The fatty amides also prevent the layers from sticking together so that the rolls of film can be more easily unwound for further processing. Erucamide, oleamide, stearamide, and behenamide are the most commonly used fatty amides. Oleamide is widely used in food packaging and as a dispersing agent in printing inks and dyes. Erucamide had the largest share of the fatty amide market in 2016. It’s used as a slip agent, anti-fogging agent, and lubricant for polyolefin films used in food packing.

Today’s market size shows the total worldwide sales of fatty amides in 2017 and projected for 2022. The increasing demand for bio-based products, as opposed to petroleum-based products, is expected to fuel growth in this industry in the next 5 years. However, price volatility is expected to impede this growth during this time period. The market for fatty amides in the Asia-Pacific region is expected to grow the fastest due to the rising population and increased demand for packaged foods.

Geographic reference: World
Year: 2017 and 2022 projected
Market size: $320.7 million and $391.5 million
Sources: “The Fatty Amides Market Size Will Grow From USD 320.7 Million in 2017 to USD 391.5 Million by 2022, at a CAGR of 4.07%,” CISION PR Newswire, March 8, 2018 available online here; “Fatty Amides Market,” Global Market Study on Fatty Amides: Increasing Demand from Film & Sheets Industry to Drive Growth of Market During the Forecast Period 2016 – 2022, Persistence Market Research Press Release, March 2016 available online here; Kenneth J. Longmoore and Edward K. Bullock, “Slip Agents and Polypropylene Films Prepared Therefrom,” United States Patent, No. US 6,497,965 B1, December 24, 2002 available online here.
Image source: ToddTrumble, “green-beans-plastic-bag-vegetable-1377124,” Pixabay, May 11, 2016 available online here.

Alpha Olefin Market

Alpha olefin word cloudAlpha olefins are organic compounds created by the processing of ethylene, a flammable hydrocarbon gas that occurs in natural gas, coal gas, and crude oil. It’s also a gas given off by ripening fruit. There are two types of alpha olefins: branched and linear. Linear alpha olefins, such as 1-butene, 1-hexene, 1-octene, and 1-decene, are created industrially by one of two processes: the oligomerization of ethylene or Fischer-Tropsch synthesis followed by purification. Three manufacturers’ processes have dominated alpha olefin processing: Chevron Phillips Chemical (CPChem), Ethyl (owned by INEOS) and Shell.

Today’s market size shows the total revenue earned from alpha olefin sales in 2016 and forecast for 2025. In 2016 North America produced the highest percentage of linear alpha olefin worldwide, 40%, followed by the Middle East (19%) and Western Europe (16%). That same year global demand for alpha olefin was more than 4.3 megatons. Demand is expected to increase to more than 6.3 megatons in 2025. Alpha olefins are used in the manufacture of high-density polyethylene (HDPE), linear low-density polyethylene (LLDPE), lubricants, plasticizers, detergents, metalworking fluids, oil field chemicals and personal care items, such as shampoos and bath and shower products.

Geographic reference: World
Year: 2016 and 2025 projected
Market size: $8.26 billion and $12.58 billion respectively
Sources: “Report Summary,” Alpha Olefin Market Analysis by Product, (1-Butene, 1-Hexene, 1-Octene, 1-Decene, 1-Dodecene), by Application (Polyethylene, Detergent Alcohol, Synthetic Lubricants), by Region, and Segment Forcasts, 2018 – 2025, Grand View Research, November 2017 available online here; “Alpha Olefin Market Size Worth $12.58 Billion by 2025 | CAGR 4.8%,” Grand View Research Press Release, November 2017 available online here; “Linear Alpha-Olefins,” Chemcial Economics Handbook, IHS Markit, March 2017 available online here; “Alpha-olefin,” Wikipedia, September 6, 2017 available online here; “Linear Alpha Olefin,” Wikipedia, November 8, 2017 available online here; “Table of Contents,” Alpha Olefin Market: By Type (1- Butene, 1-Hexene, 1-Octene, Others); By Application (HDPE, LLDPE, Lubricants, Plasticizers, Detergents, Paper Sizing, Oil Recovery, Metalworking Fluids and Others); By Geography – With Forecast (2016-2021), IndustryARC, February 15, 2016 available online here; and Saroja Narasimhan and Jon Toliver, “Examining Tomorrow’s Surfactant Personalities: Alpha Olefin Sulfonate in Personal Care,” Cosmetics & Toiletries, January 8, 2018 available online here; “Sodium Alpha-Olefin Sulfonates,” Cosmetics Info available online here.
Image source: Word cloud created in-house using Wordle™ available online here.

Nutritional Supplements Market

The market we’re presenting today is one that includes a large range of ingestible products, from vitamins and calcium pills to protein shakes, diet pills and energy drinks. The market is also referred to by various names, among them: nutritional supplements, dietary supplements, and simply, supplements. By whatever the name, this is a lucrative market and one that many people feel is less regulated than would be prudent. The federal guidelines regulating the ingredients used in the production of nutritional supplements are far less restrictive than those imposed on food and drink makers. Worth noting is the fact that federal requirements of pharmaceutical companies are even more restrictive than those regulating the food and drink industry. Nutritional supplements are not bound by the regulations for either of these industries—food and drink nor pharmaceuticals.

The supplements market has been growing steadily since the turn of the century and is expected to continue growing. Driving the growth are a number of factors. An older population looking to supplements to minimize the effects of aging is one such driver. The young, too, are using supplements heavily. Having grown up in a society that appears to approve of the use of chemicals to augment human capacities of all sorts, they turn to supplements to help build muscle, lose weight, and stay awake.

Geographic reference: United States
Year: 2011
Market size: $30 billion
Source: Natasha Singer and Peter Lattman, “Is the Seller to Blame,” The New York Times, March 17, 2013, page B1, available online here. Brittany McNamara, “Monster Energy Switches from Supplement to Beverage,” Nutrition Business Journal, February 14, 2013, available online here.
Original source: Nutrition Business Journal
Posted on March 20, 2013

E-Cigarettes

Electronic cigarettes are devices designed to release nicotine vapor without actually burning tobacco, thus, without smoke. They are battery operated devices which look like cigarettes but use a battery to produce heat which then atomizes the nicotine in a specially made cartridge. While still a small fraction of the size of the cigarette market, the market for e-cigarettes is expected to grow rapidly.

Today’s market size is the estimated total value of e-cigarette sales in the United States in 2013.

Geographic reference: United States
Year: 2013
Market size: $1 billion
Source: Josh Sanburn,”A Quitter’s Market, Electronic-cigarette Sales Are Up, and Big Tobacco Wants In,” Time, January 21, 2013, page 19.
Original source: USB; Wells Fargo; Tobacco Vapor Electronic Cigarette Association
Posted on January 15, 2013

Toiletries Market

Manufacturers of toiletries—that whole long list of things found in the bathroom for personal care: shampoo, deodorant, hand lotion, face crème, foot crème, toothpaste, perfume, hair mousse, etc.—saw robust growth over the period 1997 through 2007 but lost many of those gains between 2007 and 2009, a pattern repeated in so many industries.

Today’s market size is the size of the toiletries market as measured by U.S. manufacturers’ shipments in 1997, 2007, and 2009.

Geographic reference: United States
Year: 1997, 2007 and 2009
Market size: $24.3, $48.8 and $38.5 billion respectively
Source: 1997 Economic Census, 2007 Economic Census, and the 2009 Annual Survey of Manufactures.
Original source: U.S. Census Bureau
Posted on December 15, 2011

Bio-Based Manufacturing

In 2011, U.S. Senator Debbie Stabenow, Chairwoman of the Senate Committee on Agriculture, Nutrition, and Forestry introduced her “Grow It Here, Make It Here” initiative to spur growth in the emerging bio-based manufacturing industry. The initiative would provide a 30% tax cut for new, expanded, or re-equipped bio-manufacturing projects. Bio-based manufacturing uses agricultural goods, such as soy and wheat, to make value-added products, such as car parts, cleaning products, and plastics. This is not a new concept. Henry Ford used Michigan-grown soy and other agricultural products in his automobiles. In recent years, more and more automakers are using parts made from agricultural products. An example: the seats of the new Ford Focus and the Chevy Volt are made of Michigan-grown soy material.

Currently, bio-based products represent 4% of the plastic and chemical industry market. According to the U.S. Department of Agriculture, the potential market for bio-based plastic and chemicals could reach 20% by 2025 with federal policy support. Some studies show that if that 20% is reached, it would create more than 100,000 American jobs. This does, however, assume that agricultural production is able to keep up with strongly increasing demand and do so while maintaining competitive prices. Today’s market size is the estimated, current value of the bio-based economy in the United States.

Geographic reference: United States
Year: 2011
Market Size: $1.25 trillion
Source: “Stabenow Announces ‘Grow It Here, Make It Here’ Initiative to Advance Emerging Michigan Industry in Zeeland,” October 24, 2011, available online here.
Posted on November 4, 2011

Dietary Supplements

There is a large market for dietary supplements in the United States. This market includes a wide variety of ingestible products designed to do things such as help you lose weight, increase sexual desire, increase muscle mass, reduce cholesterol, increase brain function, and others yet. Vitamins and multivitamins are part of this market but drugs that need and carry a Federal Drug Administration approval are not.

Geographic reference: United States
Year: 2005 and 2010
Market size: $21.3 and $28.1 billion respectively
Source: Natasha Singer, “Here’s to Your Health, So They Claim,” New York Times, Sunday Business, August 28, 2011, page 1, available online here.
Original source: Nutrition Business Journal

Salt

World production of salt has grown at just above the rate of population growth over the last quarter century or so—global salt production grew by 35% while world population grew by 38% between 1985 and 2007. Salt is used in many ways, in the treatment of water, in agricultural applications, as an industrial input, in deicing operations and as a spice or food additive. In the United States, food-grade salt is the smallest of the categories of salt by end use. In fact, nearly two-thirds of U.S. salt consumption annually is related to the de-icing of roadways. This makes us wonder (with a bit of tongue in cheek) whether looking at changes in the number of paved roads there are in the northern reaches of the northern hemisphere and the southern reaches of the southern hemisphere may be a better gauge for predicting future salt demand in the world.

Today’s market size is the quantity of salt produced worldwide in 1985 and in 2007, measured in millions of metric tons.

Geographic reference: World
Year: 1985 and 2007
Market size: 190.6 and 257.0 million metric tons respectively
Source: “World Salt Production,” a spreadsheet presented on the Salt Institute’s web page, available online here.

Bulgarian Rose Oil

Rose Pedals

In 2004, supported by the Bulgarian Foreign Ministry, then-Foreign Minister Solomon Passy, and the German non-governmental organization Welthungerhilfe, a project was started in Afghanistan to cultivate Bulgarian Roses as an alternative to growing opium. Bulgarian Roses are unique in that they are cultivated for their oil, which is used in expensive perfumes. The total amount of rose oil produced in the world was 4,000 kilograms in 2010, most of that grown in the Rose Valley of Bulgaria. It takes 3,500 kilograms of rose petals to produce one kilogram of rose oil. One kilogram of rose oil sells for around 4,000-5,000 euros. Although small-scale, the rose oil industry in Afghanistan provides a living wage for 5,000 people. The market size shown is the amount of rose oil produced in Afghanistan in 2010.

Geographic reference: Afghanistan
Year: 2010
Market size: 30 kilograms valued at approximately €135,000
Source: Sofia News Agency, “Afghanistan Shows Off Own ‘Bulgarian Rose’ Oil,” novinite.com, January 24, 2011, available online here. The image used comes from an online article titled “Extract of Bulgarian Rose Oil Contains in Italian Parfume,” published on June 20, 2007, available online here.

Indian Agrochemical Market

India is the fourth largest producer of agrochemicals in the world, behind the United States, Japan, and China. An estimated $17 billion worth of crops is lost every year due to non-use of pesticides. Recently the biofertilizer sector has been trying to educate farmers about biofertilizers and biopesticides in hopes that they will switch from the chemical fertilizers and pesticides to the natural ones. Biopesticides are derived from natural materials such as animal and plant bacteria and certain minerals. According to the source, unlike chemical fertilizers, biofertilizers are effective, non-toxic, and do not lead to the deterioration in quality or fertility of the land. Data for 2012 are projected.

Geographic reference: India
Year: 2008 and 2012
Market size: $1.22 billion and $1.70 billion, respectively
Source: “Indian Agrochemical Industry Expected to Grow to 1.7 Bn by 2012,” The Economic Times, March 2, 2011, available online here.

Helium, Grade-A

Helium production and consumption

For those not involved in one of the industries in which helium is an input, the term may conjure images of party balloons. But, helium is used in a variety of industrial applications. In the United States its end users break down in the following categories: 32% for cryogenic applications; 18% for pressurizing and purging applications; 13% is used for welding; 18% for controlled atmospheres; 4% for leak detection; 2% for breathing mixtures and the remaining 13% for other applications, like party balloons.

Today’s market size is the estimated value of domestically extracted grade-A helium in 2010. The graphic shows production and apparent consumption figures for a period of 30 years, from 1980 to 2010. Apparent consumption is a calculated figure based on production, plus imports, less exports plus or minus change in stock.

Geographic reference: United States
Year: 2010
Market size: $730 million
Source: “Helium Statistics and Information,” part of a series of reports on different minerals and commodities produced by the U.S. Geological Survey and available online here.
Original source: U.S. Department of the Interior, U.S. Geological Survey (USGS)

Sodium Sulfate

Sodium sulfate is an inorganic chemical that looks like a white powder. Its chemical symbol is NA2 SO4. Sodium sulfate is used in the production of many products. Soaps and detergents account for the largest single share (35%) of its consumption. Other end uses of sodium sulfate include glass manufacturing which accounts for 18% of consumption, the paper and pulp industry uses 15%, and textile production accounts for 4% of consumption in the United States. The remaining 28% of consumption is divided among many smaller consuming end users.

The market size presented below is the estimated total value of all natural and synthetic sodium sulfate sold in 2010.

Geographic reference: United States
Year: 2010
Market size: $42 Million
Source: “Sodium Sulfate Statistics Information,” part of an annual series titled Mineral Commodities Summaries, published by the U.S. Geographical Survey and available online here.
Original source: U.S. Department of the Interior, USGS

Lice Treatments

With recent news about the reemergence of a bedbug infestation, we are reminded that the little pests that infest our lives from time to time must be dealt with over and over again. Lice are such pests and while not spoken of very often, the size of the market for lice treatments suggests that many battle these little pests in silence, behind closed doors.

Geographic reference: United States
Year: 2009
Market size: $65.88 million
Source: MMR, April 19, 2010, page 69.
Original source: SymphonyIRI