BMX Bicycles

Geographic reference: World
Year: 2020 and 2030
Market size: $230.2 million and $381.8 million, respectively

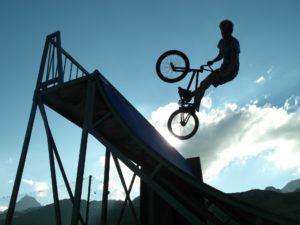
BMX racing made its Olympic debut in 2008 in Beijing, China. BMX Freestyle debuted at the 2020 Tokyo Olympics in the summer of 2021. In some cases, this may have been the first time some people had ever heard of these sports; however, they have been around for decades. BMX stands for Bicycle Motorcross. BMX racing began in the late 1960s or early 1970s in Southern California. Kids would modify their bicycles to make them more sturdy and race around empty dirt lots, performing jumps as their favorite motorcycle motocross stars did on the professional track. By 1977, loosely organized races were popping up all over the United States and the American Bicycle Association was founded to provide a national sanctioning body. It’s currently the largest BMX sanctioning body in the world, sanctioning tracks in both the United States and Canada. At the same time BMX racing was becoming popular, so was BMX Freestyle as kids would look for interesting places to ride, preferably with obstacles so they could perform stunts. By 1976, concrete skate parks were being converted for use by BMX riders, and more and more were being built around the country specifically optimized for BMX riders. By the end of the 1970s, competitions and teams were being formed and sponsors, magazines, and television started to take notice. In 1982, the American Freestyle Association, the sport’s first governing body, was founded. It organized and oversaw several competitions until 1989 when it ceased operations.

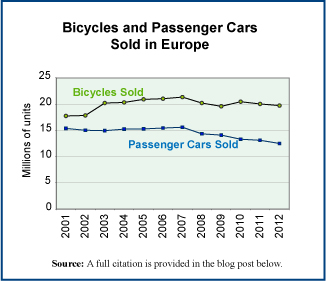
The popularity of BMX sports waned by the end of the 1980s, but since 2012, the sport has been gaining participants. In 2012, 1.86 million people aged 6 and above participated in BMX bicycling in the United States. By 2020, there were 3.88 million participants. As the popularity of BMX bicycling rose in both eras, so did the market for bicycles that could handle the rugged tracks and wear and tear of stunt riding. Today’s market size shows the total worldwide revenues for BMX bicycles in 2020 and projected for 2030. To put this data in perspective, according to Grand View Research, the overall global bicycle market totaled $54.44 billion in 2020.

Slowing down growth in this market is the high cost of equipment — bike prices range from several hundred to several thousand dollars — and the lack of biking infrastructure in many locations. As with the overall bicycle market, the BMX market saw added sales during the coronavirus pandemic, as more and more people turned to bicycling for fitness, entertainment, and in some cases, for a socially distanced alternative to public transportation. However, much of the parts used to construct BMX bicycles are manufactured in China. Factory shutdowns led to supply chain disruptions. This continued as factories opened but at reduced capacity, leading to several month delays for pre-ordered goods. Partial shutdowns at leading ports due to the pandemic are continuing to contribute to shipment delays.

BMX bicycles are specifically designed for off-road racing and stunt riding. They are lighter in weight than other bicycles and optimized for sport riding. There are six categories of BMX bicycles. Race bikes, optimized for competition, have stiff frames and specific sizing, many made of carbon fiber. Dirt, park, and street bikes are optimized for the particular venue where they will be ridden. Skatepark-specific bikes, common for freestyle and recreational riders, have a wide variety of frame and wheel sizes. Retro bikes bring back the aesthetic of the BMX bikes of the 1980s with rugged frames and more rider room. The BikeLife1 style is newer and optimized for stunt riders who perform their stunts while doing wheelies in the street. BikeLife riders tend to prefer larger frames with larger wheels.

Most BMX bicycles sold have a 20-22 inch tube length and this is expected to continue to be the case through 2030, followed by 18-20 inches, less than 18 inches, and 22-inch and above. A majority of BMX bikes are bought by those who participate in BMX-related sports. Those that use these bikes for fitness comprise the second-largest group of buyers. Leading BMX bike manufacturers include Cult Crew, Elite BMX, Fit Bike Co., Haro Bikes, Kink, MafiaBikes, Pacific Cycles, Stolen BMX, GT Bicycles, and Redline Bicycles.

1 The Cycle Squad Maniaccs invented BikeLife in Harlem, NY in 2011. Source: Riley Missel, “#BikeLife: The Revolution That’s Taking Back the Streets,” Bicycling, October 28, 2018 available online here.

Sources: “BMX Bikes Market by Top Tube Length (Less than 18 Inch, 18-20 Inch, 20-22 Inch, and 22 Inch & Above), Application (Sports, Fitness, and Others) and Distribution Channel (Online and Offline): Global Opportunity Analysis and Industry Forecast, 2021–2030,” Allied Market Research Report Overview, July 2021 available online here; “History,” USA BMX/BMX Canada, The American Bicycle Association, available online here; “BMX at the Olympics,” Union Cycliste Internationale, 2019 available online here; “Cycling BMX Freestyle,” The Tokyo Organizing Committee of the Olympic and Paralympic Games, 2020 available online here; “Extreme Sport of BMX Freestyle,” Bicycle History available online here; “Participants in BMX Bicycling in the U.S. from 2011 to 2020,” Statistia, February 2021 available online here; “American Bicycle Association,” Wikipedia, August 7, 2021 available online here; “American Freestyle Association,” Wikipedia, May 31, 2021 available online here; Ryan Fudger, “How the Coronavirus is Affecting the BMX Industry,” OurBMX, March 17, 2020 available online here; Jack Baruth, “The Best BMX Bikes for Every Rider — and Every Category,” Bicycling, April 26, 2021 available online here; Riley Missel, “#BikeLife: The Revolution That’s Taking Back the Streets,” Bicycling, October 28, 2018 available online here; Hanna Zlady, “The Shipping Crisis is Getting Worse. Here’s What It Means for Holiday Shopping,” CNN, August 23, 2021 available online here; “Bicycle Market Size, Share & Trends Analysis Report by Product (Mountain, Hybrid, Road), by Technology (Electric, Conventional), by End User (Men, Women, Kids), by Region, and Segment Forecasts, 2021 – 2028,” Grand View Research Report Summary, April 2021 available online here.
Image source: jhagen, “bmx-shadow-bicycle-jump-freestyle-1206367,” Pixabay, February 19, 2016 available online here.

Fat Bikes

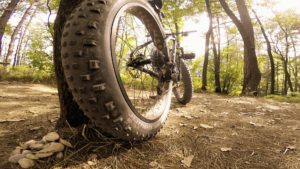
Not too long ago, Winter and its accompanying snow and ice would force bicyclists to put away their bicycles until Spring. But, in recent years, fat bikes have allowed bicyclists to ride outdoors year-round. Fat bikes have very large tires that provide traction on snow. They first came on the market a decade ago, and have gone mainstream just in the past couple of years, even though a fat bike usually costs more than $1,000. According to Jay Townley, a partner in Gluskin-Townley Group, a consultant and market research company focused on the bicycle industry, “[t]he industry, quite frankly, needed something. If anything, the fat tire bike helped to keep a stable bike industry instead of losing volume.”

Today’s market size shows the total retail sales of fat bikes in the United States in 2016. According to NPD Group, “fat tire bike sales have grown eight-fold in the past three years.”

Geographic reference: United States
Year: 2016
Market size: $74.7 million
Source: David Sharp, “Conquer Winter Snow With ‘Fat Bikes’,” Lansing State Journal, March 12, 2017, page 5D
Original source: NPD Group
Image source: Marn, Peter, “Bicycle-bicycle-tire-fat-186057,” Pexels available online here.

Wheel Sports

In the United States, more than 52 million people age 6 and above participated in wheel sports, defined as bicycling and skateboarding, in 2016. The vast majority, 45.8 million, were bicyclists; 6.4 million were skateboarders. Among bicyclists, 3.8% participated in BMX, 18.8% participated in mountain biking or rode primarily on non-paved surfaces, and the rest, 77.4%, rode their bikes primarily on roads and other paved surfaces.

Today’s market size shows the total amount spent by wheel sports participants on trip-related expenses, gear, accessories, and vehicles in 2016. Trip-related expenses made up more than 85% of the total. According to the Outdoor Industry Association, spending on wheel sports supports more than 847,000 jobs and $28.5 billion in salaries and wages. Wheel sports spending also generates more than $13.2 billion in Federal, state and local taxes annually.

Geographic reference: United States
Year: 2016
Market size: $96.7 billion
Source: The Outdoor Recreation Economy, Outdoor Industry Association, April 2017, page 18 available online here; Outdoor Participation Report 2017, Outdoor Foundation, August 7, 2017, page 37 available online here.
Image source: StockSnap, “Mountain-travel-trip-adventure-2605151”, Pixabay, August 2017, available online here.

Bicycle Accessory Market in the United Kingdom

In 2015 there were 15.8 million bicyclists in the United Kingdom. In urban areas cycling has become a convenient and environmentally-friendly alternative to other forms of transportation. Recently more and more professionals are using their bicycles to commute to work. Since 2010 the market for accessories has grown faster than the market for bicycles themselves—28 percent and 23 percent, respectively.

Today’s market size shows the value of the bicycle accessory market, which includes parts, accessories, and clothing, in the United Kingdom for 2014. That same year the market for bicycles was valued at £956 million.

Geographic reference: United Kingdom
Year: 2014
Market size: £1.25 billion
Source: Graham, Luke, “Chain Reaction: Cycling Gets a Luxury Pricetag,” CNBC, July 31, 2015 available online here.
Original source: Mintel

Bikes in Europe

EuroBikes

Bicycles outnumber automobiles in the world and always have. While bike commuting dominates in most of the developing world, it lags far behind in the industrialized centers of the world. But, this is changing, slowly. The industrial world is experiencing a rise in bicycle ridership—in Europe motivated in part by the severity of the recession and financial crisis that started in 2008—and spending on infrastructure supportive of bike commuting is on the rise.

The graph shows the number of bicycles and number of passenger cars sold annually in the 27 countries of the European Community between 2001 and 2012. While the sale of cars has fallen, the sale of bikes has been reasonably steady—despite a very serious recession—and ended the period higher than it began, with sales of 19.7 million units in 2012 versus 18.9 million in 2001.

Geographic reference: European Community
Year: 2012
Market size: 19.72 million bicycles (850,000 of these bikes were electric-assist bicycles, the segment of the market growing most quickly)
Sources: (1) European Bicycle Market, 2013 edition, Industry & Market Profile, October 2013, Association of the European Two-Wheeler Parts’ & Accessories’ Industry, page 18, available online here. (2) Martin Campestrini and Peter Mock, European Vehicle Market Statistics, Pocketbooks, 2011 Edition, ICCT, pages 39-48.
Original source: COLIBI, the Association of the European Bicycle Industry, COLIPED, the Association of the European Two-Wheeler Parts’ & Accessories’ Industry and the International Council on Clean Transportation (ICCT)
Posted on November 6, 2013

Motorized Bicycles

Ford Motor Company's eBike

Motorized bicycles can be pedaled as standard bicycles or they can be ridden with the use of a gasoline- or electric-powered engine. In 2011, Ford Motor Company introduced the E-Bike at the Frankfurt Motor Show. This bicycle has a lithium-ion battery similar to ones in newer hybrid and electric automobiles. Market share for motorized bicycles is increasing worldwide and expected to grow steadily through the 2010s.

Geographic reference: World
Year: 2010 and forecasted 2018
Market size: 30 million and 47 million units respectively with an estimated total revenue of $11.9 billion by 2018.
Source: Carrie Jones, “A Ford Bicycle,” My Ford, Spring 2012, page 9, and a report by Pike Research, “Annual Sales of Electric Bicycles Will Surpass 47 Million by 2018,” March 27, 2012, available online here. The picture comes from Ford’s media site, here.
Posted on August 7, 2012

Toys & Games

Today’s market size post is the size of the market for toys and games in 2007 based on total retail sales made in any retail outlet, from grocery stores and pharmacies to department stores and toy stores. For those wishing to investigate further, the market size posted here is based on the product category “toys, hobby goods and games” which is designated by the U.S. Census Bureau with the product code 20460.

Geographic reference: United States
Year: 2007
Market size: $90.55 billion
Source: “Sector 44: Retail Trade: Industry Series: Preliminary Product Lines Statistics by Kind of Business for the United States: 2007,” 2007 Economic Census, released on September 29, 2009available online here.
Original source: U.S. Census Bureau
Posted on December 21, 2011

Bike Parking Racks

The current Transportation Commissioner in New York City, Janette Sadik-Khan, is working on increasing the ease with which people are able to use bicycles in that city, even encouraging people to use bikes as their commuter vehicles. While New York has a long way to go to reach the level of biker welcomeness found in other large, world cities it has made progress, doubling the number of bike paths to an estimated 500 miles since 2007. As biking becomes easier in the “Big Apple” the demand for more safe places to park bikes is expected to continue to rise.

Today’s market size is the estimated number of bike parking racks in place in New York City as of the summer of 2011.

Geographic reference: New York
Year: 2011
Market size: 12,800
Source: Frank Bruni, “Bicycle Visionary,” The New York Times, September 11, 2011, page SR1.
Original source: NYC Department of Transporation and John Pucher, co-author of an upcoming book titled City Cycling.
Posted on September 12, 2011

Bicycle Share Systems

“When I see an adult on a bicycle, I do not despair for the future of the human race.” — H.G. Wells

Bicycle sharing is a system in which bicycle stations are set up at various places around a city. Each station can have tens, hundreds, or thousands of bicycles for rent, depending on demand. Customers rent the bicycles by the hour or by the day and then return them to the nearest bicycle sharing station.

These bicycle sharing systems are currently much more popular in major European cities than they are in cities in the Americas. However, the United States outranks any other country when it comes to bicycle sharing systems on college and university campuses with 24 such systems nationwide. Mexico, Philippines, and the United Kingdom are the only other countries with bicycle sharing systems on college campuses, each having just one station. As of June 2011, Warsaw, Poland; Boston, Massachusetts; and Lansing, Michigan were in the planning stages of adding bicycle sharing systems to their cities. Eric Schertzing, organizer of the Lansing, Michigan effort, said “he envisions bike sharing to be most appealing to downtown employees and tourists, and possibly renters who don’t want to haul bicycles up and down apartment stairs.”

Geographic reference: World
Year: 2008, 2009, 2010
Market size: 92, 160, and 238 stations respectively
Source: “Selling Smart Bicycles: A Delicate Dance, Part 2,” viaCycle, May 26, 2011, available online here; Lindsay VanHulle, “Ingham County Considering $100,000 Bike Sharing Service,” Lansing State Journal, June 23, 2011, available online here; “List of Bicycle Sharing Systems,” Wikipedia, available online here.

“Green” Commuting

Ways to commute to work

Whenever we hear about the rising price of oil, most of us immediately worry about the increased cost for the gasoline we put in our vehicles to get us to and from work each day. But for some of us, this is not a worry. Although still a small percentage of the working population as a whole, increasing numbers of workers are choosing to bicycle or walk to work. And, some of us who are able are choosing to work from home, thereby not commuting at all. The data show the number of workers 16 years old and over who bicycle or walk to work and those that work from home. Numbers in parentheses represent the percentage of the working population as a whole.

Geographic reference: United States
Year: 2000 and 2009
Market size: Bicycle to work — 566,384 (0.4%) and 831,551 (0.6%) respectively
Market size: Walk to work — 3,417,080 (2.7%) and 4,019,162 (2.9%) respectively
Market size: Work from home — 4,009,006 (3.2%) and 5,959,448 (4.3%) respectively
Source: American Community Survey, various dates, available online here.
Original source: U.S. Census Bureau

Sports Equipment

As basketball fans indulge in the offerings of March Madness, we look at sales of sporting equipment. Interestingly, when it comes to basketball, there is not much equipment needed, just a hoop and a ball. Basketball apparel, well, that’s another matter. Sporting apparel is not, however, included in today’s market size although it is included in the source table for those interested. Today’s market size covers a vast array of sporting equipment types, from fishing rods to golf clubs, tennis rackets to scuba tanks, and skis to fencing foils, to name but a few. Oh, and exercise equipment is included as well.

Geographic reference: United States
Year: 2009
Market size: $24.6 billion
Source: “Table 1249 – Sporting Goods Sales by Product Category: 1990 to 2008, and Projection, 2009,” Statistical Abstract of the United States: 2011, page 770, available online here.
Original source: National Sporting Goods Association

Motorcycle Travel

This past decade or so has seen increased number of passenger-miles traveled by motorcycle in the United States. Yet a closer look at the data shows that since the number of motorcycles registered rose at a faster rate (81%) than did the passenger-miles traveled (59%) between 2000 and 2008, each bike, on average, actually traveled slightly fewer miles in 2008 than it did in 2000. Motorcycle registrations in the United States numbered 4.3 million in 2000 and 7.8 million in 2008.

Geographic reference: United States
Year: 2000 and 2008
Market size: 11,516 and 18,395 million passenger-miles respectively
Source: “Table 1-37: U.S. Passenger Miles (Millions),” Bureau of Transporation Statistics, National Transportation Statistics, available online here.

Bicycle Market

Bicycle sales in 2009 were down sharply from the two prior years in which 18 million units were sold. The United States is the second largest national bicycle market in the world, second to the leader, China. In terms of types of bicycles, mountain bikes are the leading category with 27.8% of the U.S. market. The other bicycle categories and their respective market shares are as follows: Youth, 21.3%; Hybrid/Cross, 20.4%; Road, 14.9%; Comfort, 10.3%, and Cruiser, 3.3%.

Geographic reference: United States
Year: 2009
Market size: 14.9 million units
Source: “Industry Overview 2009,” 2010
Original source: U.S. Department of Commerce and Gluskin Townley Group

Have a nice weekend everyone!

Global Motorcycle Market

The market is expected to grow as standards of living rise around the world making motorcycles an affordable alternative to bicycles. Continued volatility of prices for gasoline will also favor the sale of motorcycles over automobiles in many markets.

Geographic reference: World
Year: 2008
Market size: 79.2 million units
Source: “World Motorcycles,” August 2009
Original source: Freedonia Group

Dirt Bike Market

Dirt bikes are lightweight motorcycles designed for rough terrain and often used in a racing sport called motorcross. The three leading dirt bike manufacturers are all Japanese firms—Honda, Yamaha and Kawasaki. The market size is based on unit sales in the years listed.

Geographic reference: United States
Year: 2008 and 2009
Market size: 146,801 and 92,957 bikes respectively
Source: Dealernews, June 2009, page 34