Commercial Airline Baggage Fees

One of the ways airlines have found to raise revenue, while remaining competitive in the electronic marketplace for airline fares, is to charge separately for some services that were traditionally covered in the ticket price, such as meals, seat selection, and baggage handling. While U.S. airline revenue from baggage fees went up at a rate of 17.23% per year from 2007 through 2012 overall operating income rose over the same period at a rate of 2.14% annually.

Today’s market size is the total amount charged by all U.S. commercial airlines, annually, for fees associated with the handling of baggage.

Geographic reference: United States
Year: 2007 and 2012
Market size: $464 million and $3.486 billion respectively
Source: Martha C. White, “Airlines Cash In on Every Inch, Even the Jammed Bins Overhead,” The New York Times, October 11, 2013, page 1, available online here.
Original source: U.S. Department of Transportation, Bureau of Transportation Statistics
Posted on October 14, 2013

U.S. Airlines

miles and operating revenue

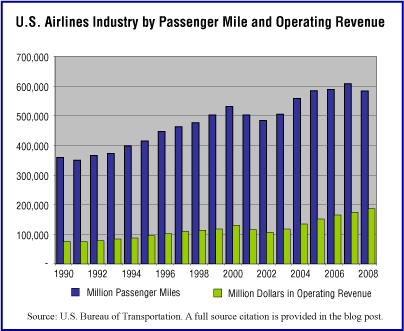
The graphic to the right presents both passenger miles of travel provided by U.S. airlines between 1990 and 2008 and operating revenues in those years. The picture this graph presents is a pleasant one with both measures rising pretty steadily over the period shown, with the notable exception of 2001 and 2002, the years for which the terrorist attacks of 2001 had the greatest impact on air travel. However, the airline business is a complicated business. As it turns out, over this same 19 year period, the industry as a whole suffered cumulative losses of $45.3 billion.

Today’s market size is the operating revenue earned by Airlines in 2008, a year in which the industry had losses of $23 billion. Running an airline is a complicated business to be sure.

Geographic reference: United States
Year: 2008
Market size: $186.12 billion
Source: “Table 1073. U.S. Scheduled Ariline Industry — Summary: 1995 to 2009,” Statistical Abstract of the United States 2012, page 677 and earlier editions. A PDF of page 677 of the work is available here. “Table 1-37: U.S. Passenger-Miles (Millions),” from the national transportation statistics available here.
Original source: U.S. Department of Transportation and U.S. Census Bureau
Posted on September 30, 2011

Airline Industry Worldwide

At the Show in 2009

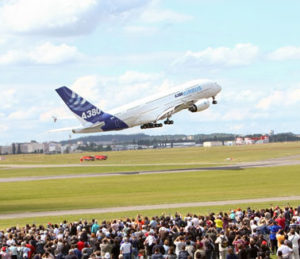
Today’s market size is the estimated net profits of the worldwide airline industry. The Paris Air Show is being celebrated this week and the press coverage of this important aerospace industry show is providing many interesting glimpses of the industry. The most recent recession combined with high energy costs hit the airline industry hard, causing two years of losses. Financial returns in 2010 represent a return to profitability for the industry as a whole. The mood is good at this year’s Paris Air Show as aircraft manufacturers are hopeful that orders will be healthy this year.

Geographic reference: World
Year: 2010
Market size: $18 billion (Global airline industry net profits)
Source: Nicole Clark, “At the Paris Air Show, Anticipating a Surge in Sales,” The New York Times, June 18, 2011, page B1. The image used above is from the Paris Air Show website, here.