Apples and Cherries in Michigan

Farming is not for the weak of heart as volatility in agricultural output is still the norm. After a year of devastation for the fruit industry in the State of Michigan, this year is shaping up to be a strong recovery. No matter how much technological know-how we invest in our agricultural industries, in the end, weather can still have the final say on whether a year is a boon or a bust.

Michigan is the third largest apple producing state in the union and its state flower is the apple blossom. In 2012, unusual weather patterns in the early part of the season destroyed many of the fruit crops for the year. In 2013, the pent-up energy in the fruit bearing trees has combined with perfect weather conditions to produce what is expected to be a bumper crop for most fruits grown in Michigan.

Today’s market size is the quantity of apples and cherries grown in Michigan in 2012 and 2013, based on early 2013 crop reports.

Geographic reference: Michigan
Year: 2012 and 2013
Market size: Apples: 2.74 and 30.0 million bushels respectively
Market size: Cherries: 11 and 212 million pounds respectively
Source: Michael Martinez, “Michigan expects biggest apple crop in decades,” The Detroit News, August 31, 2013, available online here.
Original source: Apple Committee and the Michigan Farm Bureau
Posted on September 3, 2013

Moroccan Argan Oil Hair Products

Some say it strengthens hair and tastes good drizzled on a salad. Moroccan argan oil is the latest new trend in the personal-care market. Argan oil is appearing in more and more products as one of the highlighted ingredients. Under fair trade production standards, dime-sized kernels from acorn-shaped nuts are extracted by hand by Moroccan women earning the equivalent of $4 a day. These kernels are then ground down and the oil extracted. The wholesale price of argan oil in 2011 was approximately $30 per liter while in beauty boutiques around the world, a liter of argan oil sells for around $400.

In 2012, Morocco exported 700 tons of the oil, twice that exported in 2007. Today’s market size is the number of hair products containing argan oil that were introduced in 2008 and 2012.

Geographic reference: United States
Year: 2008 and 2012
Market size: 29 and 588 respectively
Source: Matthew Boyle, “Cosmetics’ Hot Elixir: Argan Oil From Morocco,” Bloomberg Businessweek, July 25, 2013, available online here.
Original source: Mintel
Posted on August 6, 2013

Peppermint Oil

Chart

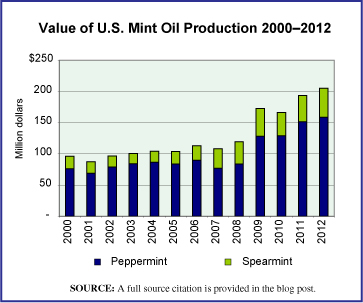
The price of mint oil, both peppermint and spearmint, has gone up sharply since the recession that started at the end of 2007. The chart shows the value of U.S. mint oil production from 2000 through 2012. Much of the increase has been due to the increased price of mint oil and not increased production. In fact, the production of peppermint oil fell over this period by 6.7% while the total value of the peppermint oil produced rose by 108%. Spearmint oil production over this period grew by 8.7% and the value of that oil grew by 134%.

Today’s market size is the number of pounds of peppermint oil produced in the United States in 2000 and 2012 and the value of the oil produced each year.

Geographic reference: United States
Year: 2000 and 2012
Market size: 7,063 pounds valued at $76.28 million and 6,592 pounds valued at $158.86 million respectively
Source: Crop Values – 2012 Summary, February 2013, page 43 and earlier reports in this annual series. These reports are produced by and put out annually by the United States Department of Agriculture, accessible in multiple formats on their website here.
Original source: USDA
Posted on May 24, 2013

Organic Products

Currently there are more than 17,000 certified organic businesses in the United States. In 2011, sales of organic foods made up more than 4% of all food and beverage sales. In 2012, sales of organic products grew 10%. Growth in this industry is expected to continue due to increasing consumer demand.

Today’s market size is the dollar amount of organic product sales in United States in 2012.

Geographic reference: United States
Year: 2012
Market size: $35 billion
Source: Mary Clare Jalonick, “Demand Aids Organic Industry’s Sway,” Lansing State Journal, May 19, 2013, page 6A.
Posted on May 22, 2013

Açaí Berries and Superfoods

The açaí berry is native to the Amazon rainforest and in particular to Brazil. It is a berry that has high quantities of phytochemicals, plant compounds that are believed to protect us from a variety of ills, from heart disease to cancer. Through heavy marketing of the berry as a sort of miracle cure, a market for this fruit was created and grew rapidly, reaching a high in 2009.

The açaí berry is what is often called a superfood, a category of foods that are nutrient dense, thus rich in vitamins, minerals and other nutrients while having few calories. So-called superfoods that are new to the U.S. market appear to follow a somewhat predictable cycle. They become the hyped new health food. Demand for them rises sharply and they ride this tide. Then they begin a decline as their high prices are balanced against the consumer’s experience with them and the promise of a new, heavily marketed superfood. Worth noting is the fact that blueberries are very nearly as rich in polyphenols as are açaí berries yet they are priced at a fraction of the price of açaí berries.

Today’s market size is an estimate of the total value of açaí-laced products sold in the United States in 2012.

Geographic reference: United States
Year: 2012
Market size: $200 million
Source: Tom Philpott, “Farm to Fable,” Mother Jones, May/June 2013, page 68
Posted on April 23, 2013

Cuban Imports

On the whole the United States has been a supporter and booster of free trade and globalization since the end of the second World War and with increased energy since the 1990s. Yet with one neighboring country, Cuba, trade relations have been unusual. The frictions in trade between the United States and Cuba date back to the 1950s and the Cuban Revolution, followed by a forty-year trade embargo imposed by the United States. In 2000, President Clinton signed the Trade Sanctions Reform and Export Enhancement Act which opened the door for some restrictive trade with Cuba, specifically, U.S. exports of farm and forestry products and some medicines. The act did not open the door for any imports from Cuba.

Today’s market size is the total value of products exported from the United States to Cuba in 2000, 2008, and 2011. The drop in exports from 2008 to 2011 is largely the result of the fact that under the restrictions imposed on this trade, Cuba is required to pay in advance for all U.S. imports in cash, something that became much harder as the financial crisis of 2008 took hold. By way of placing this level of international trade into perspective, according to CIA estimates, Cuba’s imports in 2011, from all over the world, totaled $14 billion.

Geographic reference: United States and Cuba
Year: 2000, 2008, 2011
Market size: $1.3, $711.5, and $363.3 million
Source: “2011 Exports of NAICS Total All Merchandise,” and interactive, online data resource published by the International Trade Administration and available online here. “The World Factbook,” entry on Cuba, published by the U.S. Central Intelligence Agency and make available online here.
Original source: ITA (U.S. Department of Commerce, International Trade Administration) and the CIA
Posted on January 11, 2013

Christmas Tree Farming

The sale of natural trees for use as Christmas trees has been on the decline in the United States for some time. Most likely, the decline in numbers of trees sold annually has more to do with the rise in the use of artificial trees than to an overall decline in households and establishments decorating trees for the season. In 2009, Christmas tree production in the United States was down 60% from its pace just seven years earlier, in 2002 (a U.S. Economic Census year) when 20.8 million trees were grown for sale.

Today’s market size is the number of Christmas trees grown for sale in the United States in 2009 and their approximate value that year.

Geographic reference: United States
Year: 2009
Market size: 12.9 million trees valued at $248.9 million.
Source: Dan Burden and J.S. Isaacs, “Christmas Tree Profile,” AgMRC, March 2012, available online here.
Original source: Agricultural Marketing Resource Center, Census of Horticultural Specialties, USDA and the National Christmas Tree Association.
Posted on December 17, 2012

Cranberries

Today we look at cranberries, one of the ingredients of a traditional Thanksgiving Day meal in the United States. The market we present here is the size, measured in barrels, of U.S. cranberry production annually over four decades.

We hope that as the Thanksgiving Holiday weekend proceeds in the United States, that all of our visitors have many reasons to give thanks this year.

Geographic reference: United States
Year: 1980, 1990, 2000, 2010
Market size: 2.70, 3.44, 5.84, and 6.81 million barrels respectively
Source: “Cranberries—2012 Cranberry Production Down Slightly,” August 14, 2012, and earlier reports on cranberry production, all produced and made available by the U.S. Department of Agriculture’s National Agricultural Statistics Services. The Annual reports on cranberry production are listed on the USDA’s website here.
Original source: U.S. Department of Agriculture
Posted on November 21, 2012

Pickles

Gerkins

Today’s market size is the size of the market of U.S. produced pickles and pickled products in 2005 and again in 2010. The values listed are for product shipments from the pickles and other pickled products industry (NAICS 311421P) as reported on by the U.S. Census Bureau in its reports on the manufacturing industry.

Geographic reference: United States
Year: 2005 and 2010
Market size: $1.31 and $1.46 billion respectively
Source: “Annual Survey of Manufactures: Value of Product Shipments: Value of Shipments for Product Classes,” the 2005 and 2010 editions, available online from the American Factfinder, for 2005, here, and for 2010, here.
Original source: U.S. Departemnt of Commerce, Bureau of the Census
Posted on October 2, 2012

Milk

Today’s market size is the size of milk production in the United States in 2007 and 2011. Milk prices in 2011 were at an historic high, in part because the costs of feed were also very high. The drought of 2012 has only served to tighten the feed market further and it is anticipated that both feed and milk costs will continue to rise through 2012 and beyond.

Geographic reference: United States
Year: 2007 and 2011
Market size: 185,655 and 196,246 million pounds
Source: “Milk Cows and Production by State and Region,” September 20, 2012, part of a series of reports produced by various agencies within the USDA’s Economic Research Service and available online here.
Original source: U.S. Department of Agriculture
Posted on September 21, 2012

Crop Insurance

The drought being experienced this year in most of the United States will have an impact on the cost of food in the not distant future. Farmers will have a difficult year, but how difficult? As it turns out, less than one might expect. Over the last decades there has been a significant increase in the use of crop insurance in the United States and an escalation of the subsidies received from the federal government to cover crop insurance premiums. In 2011, the federal government picked up 60% of crop insurance premiums. In fact, crop and revenue insurance now represents the primary federal support for farm income, paying $5.2 billion in direct payments to farmers and $7.4 billion in insurance premium subsidies.

Today’s market size post lists the number of acres of farmland covered by crop insurance in 1981 and 2011 as well as the total insured liability each year. The level of government subsidies for crop insurance has risen quite substantially over this period. Total premiums paid for crop insurance in 2011 were approximately $12.3 billion, of which the federal government picked up 60%, or $7.4 billion.

Our hope is that all those impacted by this drought are spared serious damage and that starvation in distant places of this ever more connected world does not rise as a result of crop shortfalls in the United States.

Geographic reference: United States
Year: 1981 and 2011
Market size: Acres: 45 million and 262 million respectively
Market size: Insured liability: $6 billion and $113 billion respectively
Source: Keith Collins and Harum Bulut, “Crop Insurance and the Future Farm Safety Net,” February 10, 2012, available online here and Andrew G. Simpson, “Cap on Subsidy of Crop Insurance Premium Would Save $1 Billion: GAO,” April 13, 2012, available online here.
Original source: FarmDocDaily, Insurance Journal, U.S. Department of Agriculture, and the U.S. Government Accounting Office.
Posted on August 1, 2012

Garden Mulch from Cypress

After a summer break, we’re ready to start posting market size entries again.

Garden mulch comes in many forms: leaves, grass clippings, pine needles, wood chips, and tree bark, just to name a few. One popular type of mulch, cypress mulch, is made from harvested trees in the Southern United States. At one time, cypress trees, wildlife-friendly and one of the most hurricane-resistant trees, were plentiful on the Gulf Coast. Many were thousands of years old. After Congress passed the Swampland Act in 1850, deeding millions of acres of wetlands to the states, many of those acres were sold to corporations for 75 cents an acre or less. By 1930, most of the virgin cypress were logged. In the past, cypress was logged for home building and flooring, but more recently, thousands of acres of cypress are being cut down to create garden mulch. Data are on an annual basis.

Geographic reference: United States
Year: 2012
Market Size: $750 million
Source: Selcraig, Bruce, “The Swamp Man,” Sierra, May/June 2012, pages 34-39
Posted on July 31, 2012

Peanut Butter

In the United States peanuts are popular. They form the basis for a staple of many American’s diets, peanut butter, a reasonably priced source of protein. As a consequence, there has been much press coverage lately about the likely increase in the price of peanut butter. The poor peanut crop in 2011 has caused raw peanut prices to rise and this increased price is expected to be seen on grocery store shelves shortly.

Today’s market size is the size of the market for peanuts for use in the production of peanut butter in the United States. In the year 2000 peanut butter accounted for the end use on half the peanut crop and in 2009 peanut butter accounted for 63.5% of peanut usage.

Geographic reference: United States
Year: 2000 and 2009
Market size: 753 million pounds and 1.19 billion pounds respectively.
Source: “Peanut Use by Type of Product,” part of the USDA’s Economic Research Service series of reports on the availability of foods by type, available here.
Original source: U.S. Department of Agriculture, Economic Research Service
Posted on January 17, 2012

Cantaloupes and Other Agricultural Commodities

Being people who work with statistical data every day it was with great pleasure that we read recently that the USDA has decided to reverse its earlier decision to eliminate dozens of longstanding statistical reports that it has maintained for decades. Turns out the industries being covered by these reports find them extremely valuable, essential really. So, industry leaders explained just how important those reports are to their planning and financing and the USDA reconsidered. We find this development most encouraging. Some things really are best done at the large scale by an entity not motivated by its own commercial interests.

Today’s market size, selected from a long list of in-depth USDA commodity reports, is the market for domestic cantaloupe. It is the value (farm value or wholesale value) of cantaloupes harvested in in the United States in 2010 when 77,430 acres were planted with cantaloupe.

Geographic reference: United States
Year: 2010
Market size: $314.4 million
Source: William Neuman, “U.S. Reverses Decision To End Farming Reports,” The New York Times, December 24, 2011, page B3, available online here. The USDA report on cantaloupes can be found online here. The figure used here is from Table 3—U.S. Cantaloupe: Acreage, Yield, Production, and Value, 1950-2010.
Original source: U.S. Department of Agriculture
Posted on December 30, 2011

Caviar

Caviar is one of those luxury items that has not seen a great decline during the recession and financial crisis that started in 2007 and 2008. In fact, demand for caviar has been strong and since overfishing in the Caspian Sea has left the sturgeon species depleted in that region, farms are emerging around the world to produce caviar and meet the strong demand.

In the 1970s, an estimated 550 tons of caviar were produced annually around the world. This caviar came primarily from wild sturgeon. Forty years later, production comes primarily from farm-raised sturgeon and while production is down sharply from the highs of the 1970s, it is expected to continue rising into the foreseeable future.

Today’s market size is the estimated total world production of caviar in 2010.

Geographic reference: World
Year: 2010
Market size: 250 tons with a wholesale price in the range of $500 to $600 per pound.
Source: Raphael Minder, “Caviar Migrates Beyond The Caspian Region,” The New York Times, December 17, 2011, page B3.
Original source: Patrick Williot
Posted on December 17, 2011

Gluten-free Foods

Gluten is a protein found in various cereal grains, most notably wheat. This protein makes for the elastic texture of dough. It is also a protein that must be avoided by those with celiac disease, a condition which seriously interferes with the body’s ability to absorb nutrients. An in-depth epidemiological study whose findings were published in 2003 found that one in every 133 people in the United States suffers from celiac disease. Celiac disease sufferers and their immediate families are a natural market for gluten-free foods and the food industry has been increasing the number of gluten-free products on the market at a rapid pace in recent years. Those gluten-free offerings include bread, cookies, crackers, breakfast cereals, and cake mixes.

Today’s market size is the estimated size by value of the gluten-free market in the Untied States.

Geographic reference: United States
Year: 2011
Market size: $6.3 billion
Source: Keith O’Brien, “Beat the Wheat,” The New York Times Magazine, November 27, 2011, page 50, available online here.
Original source: Spins, a market research firm.
Posted on November 30, 2011

Canned Pumpkin

For most people in the United States, the first two things that pop to mind when the word pumpkin comes up are pumpkin carving for jack-o-lanterns and pumpkin pie. It is the latter that inspired today’s post since pumpkin pie is one of the traditional dishes on a Thanksgiving Day menu.

Only a small portion of the pumpkins grown in the United States are actually used for decoration and jack-o-lanterns. The majority are consumed as food and most of those are processed into canned pumpkin and pie mix. The place most associated with this pumpkin processing is the town of Morton, Illinois where, in a Libby’s processing plant, approximately 85% of the world’s canned pumpkin is canned.

Today’s market size is the estimated value of the 2011 pumpkin crop in the United States. We wish all our visitors a Happy Thanksgiving.

Geographic reference: United States
Year: 2011
Market size: $116.5 million
Source: Malinda Geisler, “Pumpkins,” one of a series of reports produced by the USDA’s Agricultural Marketing Resource Center. This one is dated August 2011 and is available online here.
Original source: U.S. Department of Agriculture

Deer Breeding Market

Deer Crossing Sign

A recent crackdown on smuggling operations in Texas has shed light on a market about which many of us are probably entirely unaware. In fact, for an urban dweller, reading about the illegal smuggling of deer and deer breeding operations is a little like reading a science fiction story. It turns out that many hunters, and particularly big game hunters, are willing to pay a very high price for a deer with trophy size antlers. Since the native deer of Texas have more diminutive antlers than do the white-tail deer found further north, the illegal smuggling of big antlered deer exists in Texas. Transporting white-tail deer into Texas is restricted to help protect the native deer species from diseases not found in their herds. However, the breeding of deer with white-tail deer sperm is legal in Texas but it is very expensive. Thus, the illegal importing of white-tail deer has become a lucrative, black market in Texas.

Today’s market size is the estimated value of the legal deer breeding business in the United States.

Geographic reference: United States
Year: 2007
Market size: $650 million
Source: Cindy Horswell, “Authorities Target Texas Deer Smugglers,” South Texas Outdoors, October 19, 2011, available online here.
Original source: Texas A&M University
Posted on October 16, 2011

Bio-Based Manufacturing

In 2011, U.S. Senator Debbie Stabenow, Chairwoman of the Senate Committee on Agriculture, Nutrition, and Forestry introduced her “Grow It Here, Make It Here” initiative to spur growth in the emerging bio-based manufacturing industry. The initiative would provide a 30% tax cut for new, expanded, or re-equipped bio-manufacturing projects. Bio-based manufacturing uses agricultural goods, such as soy and wheat, to make value-added products, such as car parts, cleaning products, and plastics. This is not a new concept. Henry Ford used Michigan-grown soy and other agricultural products in his automobiles. In recent years, more and more automakers are using parts made from agricultural products. An example: the seats of the new Ford Focus and the Chevy Volt are made of Michigan-grown soy material.

Currently, bio-based products represent 4% of the plastic and chemical industry market. According to the U.S. Department of Agriculture, the potential market for bio-based plastic and chemicals could reach 20% by 2025 with federal policy support. Some studies show that if that 20% is reached, it would create more than 100,000 American jobs. This does, however, assume that agricultural production is able to keep up with strongly increasing demand and do so while maintaining competitive prices. Today’s market size is the estimated, current value of the bio-based economy in the United States.

Geographic reference: United States
Year: 2011
Market Size: $1.25 trillion
Source: “Stabenow Announces ‘Grow It Here, Make It Here’ Initiative to Advance Emerging Michigan Industry in Zeeland,” October 24, 2011, available online here.
Posted on November 4, 2011

State Fairs

All but two states in the U.S. host an annual state fair. These fairs originated as competitive venues for displaying and ranking of livestock and other agricultural products. The events usually also included competitive events for visitors, such as pie eating contests or contests of strength. The displaying of arts and crafts was also a common feature in early state fairs as it is today still. The earliest official State Fair was in Detroit Michigan. Sadly, Michigan is one of the two states which has discontinued its state fair in the last two years due to budgetary limitations. The other state is Nevada.

Minnesota—the 21st state in a ranking of states based on 2010 population—has consistently had the second ranked State Fair when measured by attendance in recent years.

Today’s market share is the size of the attendance at the 2010 Minnesota State Fair, celebrated between August 26 and September 6, 2010. This year’s Minnesota State Fair will run from August 25 through September 5, 2011.

Geographic reference: State of Minnesota
Year: 2010
Market size: 1.78 million visitors
Source: “Carnivalwarehouse.com’s 2010 Top 50 Fairs,” a ranking published annually by the source, originally Matt’s Carnival Warehouse, founded in 1997. A list of recent Top 50 lists with links to each is available online here.
Original source: Carnivalwarehouse.com