Sign Manufacturing

sign manufacturing
The International Sign Association’s Sign Manufacturing Day, in partnership with the National Association of Manufacturers’ Manufacturing Day, is October 2, 2020. On this day, in a typical year, participating manufacturing facilities host tours of their facilities to encourage students to explore careers in manufacturing. In 2020, due to COVID-19, many of the events at various manufacturing facilities will be virtual. For more information visit: https://www.signs.org/mfgday and https://creatorswanted.org/
Geographic reference: United States
Year: 1982, 1992, 2002. 2012. 2018
Market size (billions of real dollars): $2.7, $5.4, $9.8, $10.5, and $12.6, respectively
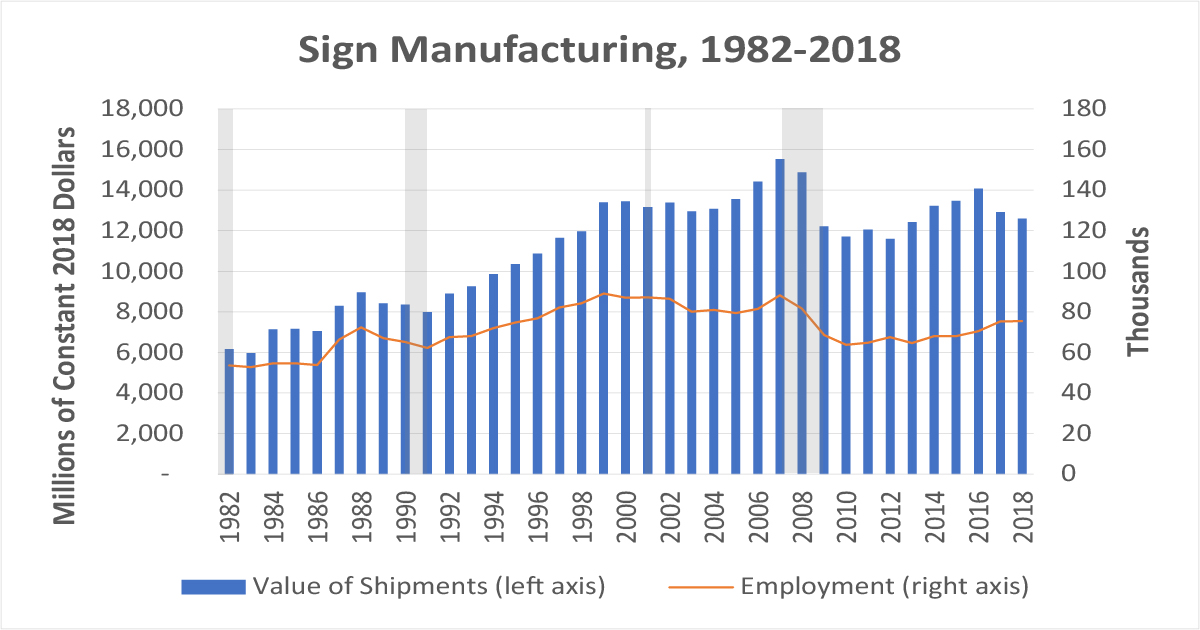
Market size (billions of constant 2018 dollars): $6.2, $8.9, $13.4, $11.6, and $12.6, respectively

Whether hand-written, laser-printed, neon or digital, signs are everywhere. Stop signs, street signs, point-of-purchase displays, signs above retail establishments, signs in restaurants displaying their menus, digital advertisements. Most people take these for granted, but sign manufacturing in the United States is a multi-billion dollar industry employing more than 75,000 people at 5,853 establishments around the country. Today’s market size shows sign manufacturing’s value of shipments for 1982, 1992, 2002, 2012, and 2018 in both real dollars and constant 2018 dollars. The graph shows more thorough views of the value of shipments in constant dollars and employment from 1982 to 2018. The gray boxes in the graph show recessionary periods.

Although sign manufacturing shipment values rose and fell several times throughout this time period, they trended upward from 1982 to 2007, reaching a high of $15.5 billion,1 before the advent of the Great Recession. By the end of the Great Recession, the value of shipments fell to 1998 levels. Since then, again, values have risen and fallen, however, the peak in 2016 fell short of the 2007 peak value. Since 2016, values have trended downward. In 2020, with manufacturing operations temporarily suspended and consumer demand for signs down due to the lockdowns in response to the COVID-19 pandemic, shipment values are expected to continue the downward trend. However, not all types of signage will see a drop. There has been increased demand for medical equipment displays for ventilators and respirators and signage for retail establishments detailing social distancing guidelines and safety practices.

Worldwide in 2018, the printed signage market totaled $45.73 billion while the digital signage market reached $18.55 billion. Printed signage is the most widely used due to its lower cost and longer lifespan without additional maintenance costs. It’s mostly used for advertisement and marketing purposes to attract customers or to showcase a product. Globally, printed signage revenues are expected to grow at a compound annual growth rate (CAGR) of 0.31% through 2025, however, in North America, revenues are expected to contract by a CAGR of -0.68% as demand for more dynamic and customized advertising has led to a decrease in printed signage demand and an increase in demand for digital solutions. As a result of this downturn, major companies are focusing their efforts on expanding their customer base outside the region. Leading printed signage companies in North America include Avery Dennison Corp., Sabre Digital Creative, Print Source Signs & Display, James Printing & Signs, Kelly Signs Inc., Chandler Inc., RGLA Solutions Inc., Accel Group Inc., AJ Printing and Graphics, Southwest Printing Co. and Vistaprint.

Digital signage revenues are expected to grow by a CAGR of 8.0% globally through 2025, and 6.4% in the United States through 2027.2 Demand for biometric technology3 and digitized information management that can be accessed from a remote location are leading to greater adoption of digital signage. In the United States increasing adoption of touch-based and gesture-based displays will lead to a significant boost to the market. Also, many advertisers prefer digital display advertising over conventional marketing for its ability to include eye-catching pictures and motion.

Video walls garnered the highest market share globally as well as in the United States due to their ease of installation, mounting, and connectivity. In-store displays4 had a higher market share than out-store displays, but out-store displays are expected to experience the highest growth over the next few years as more digital displays are installed in transportation venues such as bus stands, train stations, railway stations, airports, and inside taxi cabs, buses, trains, and subway cars in order to show promotional as well as informational content. Digital signage demand at concert and other entertainment venues will see a drop in 2020 while they remain closed during the COVID-19 pandemic, however, interest is expected to increase in 2021 and beyond as more sites open to patrons again.

Worldwide, vertically-oriented content—safety signs and information, corporate communication, sales dashboards, direction and transportation information—had a market share of more than 50% in 2018. Health and wellness and news also accounted for significant market share and these two categories are expected to grow substantially in the coming years due to higher demand in the healthcare and corporate sectors. In the U.S., the retail sector topped market share as leading adopters of the technology, but there is also tremendous growth potential in this sector. Revenues for digital signage in the healthcare sector are expected to grow substantially in the United States through 2027. Digital signage in healthcare is used to manage inventory and staff, notify staff and visitors, and display patient-related information. Leading digital signage manufacturers in the United States include NEC Display Solutions of America Inc., BrightSign LLC, Planar System Inc., Cisco Systems Inc., Intel Corp., Microsoft Corp., Keywest Technology Inc., Scala Inc., Visix Inc., Panasonic Corp. of North America, and Hughes Network Systems LLC. Worldwide, companies are focusing on innovation to increase revenues. Intel Corp. introduced the Open Pluggable Specification that is helping to standardize the design of digital marketing and Nippon Telegraph and Telephone Corp. has developed digital signs that use aroma-emitting devices.

1 Real dollar value: $13.0 billion.
2 All compound annual growth rates reported were calculated before the COVID-19 pandemic response slowed or halted production and demand.
3 Biometric technology includes gaze tracking software that can record how many people look at an ad, even in a crowded area.
4 In-store displays include all displays deployed within buildings, not just in retail locations.

Sources: Annual Survey of Manufactures, U.S. Census Bureau, various years available online here; Economic Census, U.S. Census Bureau, various years available online here; County Business Patterns, U.S. Census Bureau, June 25, 2020 available online here; Dan Barufaldi and Jim Chappelow, “A Review of Past Recessions,” Investopedia, June 8, 2020 available online here; “Five Jobs and Industries That Are Thriving Amid The COVID-19 Pandemic (and Why),” The Marlin Company, June 4, 2020 available online here; “Printed Signage Market – Growth, Trends, and Forecast (2019-2024),” 360 Market Updates, June 1, 2019 available online here; “North America Printed Signage Market – Growth, Trends, and Forecast (2019 – 2024),” Research and Markets Report Description, February 2019 available online here; “Printed Signage Market – Growth, Trends, and Forecast (2020-2025),” Mordor Intelligence About This Report available online here; “Digital Signage Market Size Analysis Report by Type, by Component, by Technology (LCD, LED, Projection), by Application, by Location, by Content Category, by Size, by Region, and Segment Forecasts, 2019 – 2025,” Grand View Research Report Summary, May 2019 available online here; “U.S. Digital Signage Market Size, Share & Trends Analysis Report by Component, by Hardware Components, by Display Type, by Display Technology, by Application, by Location, by Region, and Segment Forecasts, 2020 – 2027,” Grand View Research Report Summary, February 2020 available online here; Nina Goetzen, “Entertainment Digital Ad Spend Will Drop 6.9% This Year, But Gaming and SVOD Growth Will Offset Losses,” Business Insider, September 10, 2020 available online here.
Image source: Created in-house by The Editors from Annual Survey of Manufactures and Economic Census data.

Addressable TV Ads

addressable TV ads

According to the American Time Use Survey, conducted by the U.S. Bureau of Labor Statistics, on any given day nearly 80% of U.S. adults watch TV. And, despite the increasing popularity of cord-cutting, 78% of households still subscribe to pay-TV, whether that be via cable, satellite or through their telecommunications provider.1 Millions of households also subscribe to at least one online video service, either in addition to their pay-TV subscription or in the case of cord-cutters, instead of it. In 2017, American households watched an average of 7 hours and 50 minutes of television per day.2

Traditionally, advertisers used Nielsen television ratings data and consumer surveys to target advertising campaigns based on a program’s targeted audience by age and gender. As more devices, including televisions and set-top boxes, became connected to the Internet, more data became available about the viewers themselves. Addressable TV advertisements are personalized ads based on household characteristics such as income, lifestyle interests, shopping behavior, and family composition. They’re shown during live or on-demand television programs delivered via cable, satellite, telecom, or streaming services. Traditional TV ads target an audience based on a show’s content. Everyone watching a particular show sees the same advertisements. Addressable TV ads target the household’s viewers regardless of what content they are watching. Different types of households see different advertisements even if they’re watching the same program.

Out of the 120 million households in the United States that own televisions, more than 65 million can be served addressable ads, according to Cadent, an advanced TV advertising agency. However, ad sellers make only one-eighth of ad inventory available for targeted ads. As Pay-TV providers upgraded their equipment to allow for more addressable TV ads, advertisers found it difficult to create national addressable TV ad campaigns. Cable and satellite companies can only target ads to their subscribers, therefore advertising agencies needed to contract with multiple pay-TV providers at a local level to put together a national advertising campaign. This changed in 2018. NCC Media, a TV advertising sales firm owned by Charter Communications Inc., Comcast Corp., and Cox Communications, created a division to sell targeted ads across all of its parent companies’ platforms, reaching 45 million households. Xandr Media, AT&T’s advertising sales division, struck deals with Altice USA Inc. and Frontier Communications Corp. to be able to sell addressable ads on their platforms as well as AT&T’s DirectTV, reaching 20 million households.

Today’s market size shows the estimated amount spent on addressable television advertisements in the United States in 2018 and projected for 2020. According to the source, this market will remain small compared to traditional television ad spending, which totaled $69.87 billion in 2018 and is projected to reach $71.18 billion in 2020.

1 Leichtman Research Group study.
2 Nielsen.

Geographic reference: United States
Year: 2018 and 2020
Market size: $2.06 billion and $3.37 billion, respectively
Sources: Audrey Schomer, “Vizio is Teaming Up With Disney, NBCU, and Turner to Develop an Open Standard for Addressable TV Advertising.” Business Insider, March 14, 2019 available online here; Tim Peterson, “Agency Ad Buyers Say There Isn’t Enough Addressable TV Inventory,” Digiday, March 21, 2019 available online here; “What is Addressable TV?” July 2018 available online here; “Programmatic vs. Addressable for Dummies,” June 17, 2015 available online here; Tim Peterson, “‘There is Scale There’: Myths of Addressable TV Advertising, ” Digiday, December 19, 2018 available online here; Rachel Krantz-Kent, “Television, Capturing America’s Attention at Prime Time and Beyond,” Beyond the Numbers, U.S. Bureau of Labor Statistics, September 2018 available online here; Daniel Frankel, “Pay TV in 78% of U.S. Homes, Down 8% in Five Years: Research Company,” Multichannel News, October 31, 2018 available online here; Alexis C. Madrigal, “When Did TV Watching Peak?” The Atlantic, May 30, 2018 available online here; Todd Spangler, “Cord-Cutting Keeps Churning: U.S. Pay-TV Cancelers to Hit 33 Million in 2018 (Study),” Variety, July 24, 2018 available online here.
Original source: eMarketer
Image source: StockSnap, “room-office-modern-lectronic-2559790,” Pixabay, July 31, 2017 available online here.

Social Media Management

social media management

Facebook, Twitter, Instagram, YouTube, Pinterest, LinkedIn. Social media platforms with millions of active users. For businesses that have products to sell or services to offer, posting on these sites is a way for them to advertise to potential customers and to engage with current customers. In 2017, 77% of marketers used at least one social media site to promote their company’s product or service; however, only 48% reported a return on their investment.

To try to increase their chances of success many companies develop social media strategies. As part of these strategies, they choose which platforms to utilize. Not all platforms may be appropriate for all types of marketing. A social media strategy considers who the target audience will be, what types of content will be posted and how often to post content. Because each platform may target a different demographic, posting the same content across all platforms is not always beneficial. Therefore, a posting schedule may need to be implemented showing what to post and when to post it to each platform.

After a strategy is in place, the work of creating the written content, images, and videos is undertaken. Companies may find that sharing relevant third-party content is also a favorable way to engage followers. Once followers are engaged, responding to comments or questions in a timely manner is important. Some companies may reach out through social media to other businesses and influencers in the same industry to increase the number of people seeing their content. Creating advertising campaigns, contests, and giveaways are other ways of promoting a product or service.

Once a strategy is in place, content is posted, and followers are engaged, a company then evaluates the strategy’s effectiveness. Whether a company employs one person or a team of people to handle its social media presence, social media management tools and services exist to help a company optimize its resources. Social media management software can help employees use their time more effectively, and social media management services can provide experts at all levels of the process from strategizing to post creation, customer engagement, and analysis.

Today’s market size shows the amount companies spent on social media management worldwide in 2018 and forecast for 2023. Demand for cloud-based software is expected to grow the most during this time period. Cloud-based tools can be implemented rapidly, may cost less, and are easy to use. They can also be customized to an organization’s current and future needs. The major companies that provide social media management tools and services include IBM Corporation, Oracle Corporation, Salesforce, Adobe Systems, Hootsuite Inc, Sprout Social Inc., Google Inc., Sysomos, Sprinklr Inc., Digimind, Clarabridge, Spreadfast, Falcon.io, Zoho Corporation, and Lithium Technologies LLC.

Geographic reference: World
Year: 2018 and 2023
Market size: $9.2 billion and $17.7 billion, respectively
Sources: “MarketsandMarkets Expects The Global Social Media Management Market Size to Grow From USD 9.2 Billion in 2018 to USD 17.7 Billion by 2023, at a Compound Annual Growth Rate (CAGR) of 14.1%,” Cision PR Newswire, February 25, 2019 available online here; Sean, “What Is Social Media Management and Why You Need a Social Media Management Company,” LYFE Marketing Blog, January 12, 2018 available online here; Robert Allen, “Does Social Media Marketing Actually Generate ROI?” Smart Insights, June 26, 2017 available online here.
Image source: 905513, “marketing-social-media-advertising-1573711,” Pixabay, August 8, 2016 available online here.

Medical Marketing

Does it seem like you’re seeing more ads for prescription medications and medical services? You’re not imagining it. In 2016, the last year for which data were available, pharmaceutical companies alone bought 4.6 million direct-to-consumer ads, up from 79,000 ads in 1997. Spending increased nearly six-fold, from $1.3 billion to $6.0 billion during this time period. Total medical services advertising expenditures grew at a similar rate, led by cancer centers, mental health and addiction services, and cosmetic surgery services.

According to PhRMA, the largest pharmaceutical trade group in the U.S., direct-to-consumer advertising provides “scientifically accurate information to patients so that they are better informed about their health care and treatment options.”1 Around half of the consumers in a 2015 analysis by the U.S. Food and Drug Administration believed these ads did not contain enough information about the medications’ risks and benefits to be of use. That year, the American Medical Association (AMA) called for a ban on pharmaceutical and medical device advertising, saying that ads such as these encourage consumers to seek out more expensive treatments when less expensive, more appropriate, effective alternatives may be available. In addition, the AMA was concerned that increased spending on advertising led to higher prescription drug prices. Banning such advertising would not be easy, even if Federal lawmakers agreed that such a ban should take place. Several court cases throughout the years determined that this type of advertising is protected by the United States Constitution.

Today’s market sizes show total medical marketing spending and spending on a subset of that, direct-to-consumer advertising, in 1997 and 2016. Medical marketing includes advertising of prescription drugs, health services, and laboratory testing. It also includes disease awareness campaigns. Marketing to health care professionals by pharmaceutical companies accounted for most of the spending during this time period. However, as a percentage of total spending, this has been dropping. In 1997, 88.1% of medical marketing dollars were spent on free samples, direct physician payments for such things as speaking engagements and meals, and prescriber detailing, in which pharmaceutical sales representatives educate physicians about their products. In 2016, 67.9% of marketing dollars were spent this way. Direct-to-consumer marketing comprised the balance.

1 PhRMA spokesperson Tina Stow. Source: Susan Kelly, “U.S. Doctor Group Calls for Ban on Drug Advertising to Consumers,” Reuters, November 17, 2015, available online here

Geographic reference: United States
Year: 1997 and 2016
Market size: (Total) $17.7 billion and $29.9 billion, respectively
Market size: (Direct-to-consumer advertising) $2.1 billion and $9.6 billion, respectively
Sources: Lisa M. Schwartz, MD, MS and Steven Woloshin, MD, MS, “Medical Marketing in the United States, 1997-2016,” JAMA, Special Communication, January 1-8, 2019 available online here; Susan Kelly, “U.S. Doctor Group Calls for Ban on Drug Advertising to Consumers,” Reuters, November 17, 2015, available online here; Alison Kanski, “7 Things to Know from Dartmouth’s Medical Marketing Study,” MM&M, January 14, 2019 available online here; Margaret Rouse, “Pharmaceutical Detailing,” TechTarget, February 2011 available online here.
Image source: Martin Brosy, “Doctor with a Stethoscope,” Unsplash, July 30, 2018 available online here.

Social Media Analytics

social media analyticsWhat do people think of our product? How successful was our last marketing campaign? Not that long ago if businesses wanted to know the answer to these questions they would have to hire market research firms that would poll select customers about their thoughts. With the widespread use of social media and improved natural language processing and machine learning algorithms, social media analytics tools can provide a more comprehensive picture of how consumers feel about companies and their products.

Social media analytics software is used to gather data from various social media sites in order to guide a business’ marketing strategy. Each social media platform offers its own analytics interface, but for companies whose presence on social media is multi-faceted, a more robust software option is necessary, one in which data is tracked on several platforms at once, and in some cases, in real time. Sophisticated software with natural language processing will attempt to understand meaning and context in text and human speech. The analyzed data can then be used to target marketing campaigns, improve customer service, or improve existing products, among others.

Today’s market size shows the amount businesses around the world spent in 2016 and are projected to spend in 2022 on social media analytics tools. According to the source, cloud-based social media analytics tools are expected to experience the highest growth during this time period due to their cost-effectiveness, scalability and flexibility in allowing businesses to oversee their campaign management and performance monitoring. Currently, there are more than 25 key companies worldwide that create social media analytics tools.

Geographic reference: World
Year: 2016 and 2022 projected
Market size: $2.1 billion and $9.5 billion respectively
Sources: “Social Media Analytics Market: Global Market Size to Reach $9463.54 Million by 2022,” Nasdaq GlobeNewswire Press Release, December 22, 2017 available online here; Margaret Rouse and Ed Burns, “Social Media Analytics,” TechTarget, June 2017 available online here; Margaret Rouse and Craig Stedman, “Unstructured Data,” TechTarget, January 2018 available online here.
Image source: Maialisa, “marketing-social-media-advertising-1573711,” Pixabay, August 8, 2016 available online here.

Digital Video Marketing

Digital video marketing word cloudAccording to Jim Louderback, CEO of VidCon, an annual online video conference held in Southern California, “[t]he younger you are the more likely you are to want to consume information in video form. If you’re under the age of 35, video is the way you want to be communicated with, it’s the way you want to learn and understand.” Knowing this, 56% of businesses surveyed by mobile video platform Magisto said they produce video content at least once a week, with 26% producing content daily. However, among companies that spend more than 25% of their marketing budget on video, those companies whose marketing departments are run by Millennials are less likely than those run by Generation Xers to spend money on business videos and less likely to create business video content on a daily basis.

Today’s market size shows the estimated amount businesses in the United States spent on digital video marketing in 2017. This figure includes the cost of video capturing, creation, hosting, distribution, analytics, and staffing. By contrast, businesses were expected to spend $83 billion on digital advertising and $71 billion on television commercials in 2017.

Geographic reference: United States
Year: 2017
Market size: $135 billion (estimated)
Sources: Chaykowski, Kathleen, “Digital Video Marketing is a $135 Billion Industry in the U.S. Alone, Study Finds,” Forbes, October 17, 2017 available online here; Video’s Payday: Part I: The Modern Marketing Dilemma and The State of Business Video, Magisto, available online here.
Original source: Magisto
Image source: Word cloud created in-house using Wordle™ available online here.

Athlete Endorsements

With the end of the 2014 Winter Olympics having been celebrated yesterday, we turn our attention today to the subject of how much is spent every year paying athletes to endorse products. By its very nature, the endorsement of an athlete requires that the athlete be a superstar, at least within his or her own sport. Thus, it will come as no surprise that 70% of the earnings from athlete endorsements in 2013 were earned by the top 100 such spokesmen and women.

The top three earners included two golfers and a tennis player, in order; Tiger Woods, Roger Federer, and Phil Mickelson. Also of interest, only four women made the top 100 list, each is a tennis player. When the top one hundred athlete endorsement deals of 2013 are analyzed by sport, one sees that basketball has the largest number of players on the list and earns the largest total of the athletic endorsement pie (15%). A full breakdown by sport is provided in a detailed table on the source website, a link to which is provided below.

Today’s market size is the approximate value of all athlete endorsements, worldwide, in 2013. We give a tip of the hat to the Ghulf Genes blog for a link to the source of today’s market size.

Geographic reference: World
Year: 2013
Market size: $1.1 billion
Source: “Top 100 Highest-Paid Athlete Endorsers 2013,” Opendorse, available online here.
Posted on February 24, 2014

Super Bowl TV Ads

SuperBowlAds

The Super Bowl is one of the big, annual TV events in the United States and as such it draws a large number of views. As a result, those wishing to reach a broad audience and having lots of money to spend, like to advertise during the Super Bowl. In fact, for many viewers, the advertisements themselves have become part of the attraction of the event.

The pie graph we present here shows ad spending by industry category in 2003 and 2013. Clearly, the auto industry has decided that the Super Bowl is a great way to grab attention for new cars and trucks. In 2013 that industry accounted for 33% of Super Bowl ad spending, up from 7% in 2003.

Today’s market size is the total spent on TV advertisements during the Super Bowl in 2003 and in 2013. The source we link to below provides a very interesting, interactive graphic with details on each Super Bowl from 2000 through 2013 as well as links to videos of memorable advertisement broadcasts in each year.

Geographic reference: United States
Year: 2003 and 2013
Market size: $130 and $292 million respectively
Source: Andrew Garcia Phillips and Willa Plank, “Super Bowl Spending Driven by Automotive Ads,” Wall Street Journal, available online here.
Original source: Kantar Media
Posted on February 5, 2014

Digital Ad Spending

Measuring the world of advertising is tricky and when it comes to how much is spent on digital advertising, the task becomes harder yet. Part of the difficulty has to do with how one defines the market being measured, as is always the case when dealing with market sizes. But, in the case of an industry that is still forming and evolving, definitions are crucial. Clear definitions of what is being measured are not always provided by those reporting on these markets or those reporting on those reports. So use this market size data as a general guide to a market whose boundaries are a bit… fluid.

Today’s market size post is the size of the market for digital advertising based on two estimates of how much will be spent worldwide on digital advertising in 2013. The range presented is made up of the two estimates, sources for which are also provided. Worth noting is the fact that these estimates place spending on digital advertising at around one-fifth of the spending on all advertising.

Geographic reference: World
Year: 2013
Market size: $95 to $117 billion
Source: John Bussey, “When Google Brainstorms, The Online World Shudders,” Wall Street Journal, September 27, 2013, page B1. Michael Sebastian, “Ad Spending Forecast Revised Downward,” AdAge, August 14, 2013, available online here.
Original source: eMarketer and GroupM
Posted on October 9, 2013

Polling Services

The long political campaign season is finally over in the United States. One of the striking aspects of this year’s campaign cycle was the seemingly endless supply of new polling data, from multiple sources on a daily basis.

Today’s market size is the size of the revenues for the polling services industry in the United States, in 2002 and 2010. The industry is defined, within the North American Industrial Classification System, as follows: “This industry comprises establishments primarily engaged in systematically gathering, recording, tabulating, and presenting marketing and public opinion data.” Its industry code is 541910. The sorts of services provided by this industry include:

Broadcast media rating services
Marketing analysis services
Marketing research services
Opinion research services
Political opinion polling services
Public opinion polling services
Public opinion research services
Statistical sampling services

Geographic reference: United States
Year: 2002 and 2010
Market size: $10.89 billion and $16.74 billion respectively
Source: “Table 6.1. Professional, Scientific, and Technical Services (NAICS 54) – Estimated Revenue for Employer Firms: 2002 Through 2010,” 2010 Service Annual Survey, February 2, 2012, available online from the Census Bureau’s website.
Original source: U.S. Department of Commerce, Bureau of the Census
Posted on November 9, 2012

Spending on TV Ads During Sporting Championships

As we prepare to feast upon the spectacle that is the Super Bowl there is much talk about the advertisements that will be shown during the game. Turns out, in three of the last five years baseball’s World Series actually sold more advertising during its championship series than did the Super Bowl, with far less attention to the fact. But the baseball World Series is, of course, a series and not a single, super hyped game. There is no question that Super Bowl ads have become for many part of the show.

Today’s market size is the spending on network television advertising during the broadcasting of major sporting championships in 2011.

Enjoy the spectacle!

Geographic reference: United States
Year: 2011
Market size: Football – Super Bowl $228 million
Market size: Baseball – World Series $269 million (7 game series)
Market size: Basketball – NCAA Mens BB Final Four $170 (3 games)
Source: Jack Loechner, “Super Bowl Ad Stats,” a blog post on MediaPost, January 30, 2012, available here.
Original source: Kantar Media
Posted on February 4, 2012

DTC Drug Advertising

Ad Spending

Direct-to-consumer (DTC) advertising of prescription drugs is a big business in the United States, as it is in New Zealand, the only other country in which this activity is legal. Anyone who watches TV for more than an hour or two a week will be more than familiar with the sorts of ads we are talking about, those that invariably end with an ominous list of potential side effects of the very drugs being pushed.

Until the late 1990s this advertising was quite limited by FDA regulations but in 1997 the FDA announced changes to those regulations (implemented in 1999) that freed up the pharmaceutical industry to start producing stylish ad campaigns for its most popular prescription drugs. The industry took full advantage, as the graph above clearly shows. Industry analysts suggest that the slowdown in spending starting in 2007 had more to do with the expiration of important brand name drugs (and their replacement with generics for which such spending is not done) than with the beginning of the recession.

Today’s market size is the amount spent by pharmaceutical companies on DTC prescription drug advertising in 2008.

Geographic reference: United States
Year: 2008
Market size: $4.57 billion
Source: For the data from 1989 through 2001: Francis B. Palumbo and C. Daniel Mullins, “The Development of Direct-to-Consumer Prescription Drug Advertising Regulations, Food and Drug Law Journal, Volume 57, Number 2, 2002. For the data from 2002 through 2005: Donahue Ph.D., Julie M., Marisa Cevasco, B.A. and Meredith B. Rosenthan, Ph.D., “A Decade of Direct-to-Consumer Advertising of Prescription Drugs,” The New England Journal of Medicine, August 16, 2007. For data from 2006 through 2008 the data are from Nielsen Media press releases.
Posted on January 20, 2012

Advertising

Bar graph
The reasons for placing an advertisement vary, from wishing to sell something to finding a partner, from raising funds to trying to alter public opinions about an institution, organization or candidate. Advertising is a big business, from the creation of the ad to buying the time or space for placing that ad to the strategies behind ad campaigns and nowhere is it as big a business as in the United States. For more on how the U.S. stands relative to all other nations when it comes to spending on advertising, check our earlier market size post, here.

The business of advertising is divided into categories by the Census Bureau which reports on each category: Advertising, Public Relations and Media Buying Agencies, Media Representatives, Display Advertising, Direct Mail Advertising and all other. Among these categories, three have shown the most growth over the last decade (from 2001 to 2009): Media Buying Agencies saw growth of 322%, Display Advertising grew by 68.4% and all other advertising grew 46.7%. The all other advertising category covers some of the online advertising business that does not fit into one of the other categories. One category saw losses over this period, the Direct Mail Advertising category which is particularly vulnerable to cutbacks during recessionary periods. Overall, the industry (NAICS 5418) saw revenue grow by 37.8% between 2001 and 2009 and another 8.7% between 2009 and 2010.
The chart we offer here shows revenue from all these sectors of the industry from 1997 through 2010. Of interest is the fact that the recession of 2001 had a larger impact on the industry’s revenues than did the larger recession of 2007–2009.

Geographic reference: United States
Year: 2001 and 2010
Market size: $58.634 and $87.836 billion respectively
Source: “Table 6.1 Professional, Scientific, and Technical Services (NAICS 54)—Estimated Revenue for Taxable Employer Firms: 2001 Through 2009,” 2009 Services Annual Survey, and “Table 1 – Selected Services Estimated Quarterly Revenue for Employer Firms Fourth Quarter 2003 Through Fourth Quarter 2010,” from the same series and available here.
Original source: U.S. Census Bureau
Posted on January 4, 2012

Coupons

In 2010, 332 billion coupons were issued in the United States, 88% of them were in newspaper inserts. Of those 332 billion, a mere 1%, or 3.3 billion, were redeemed. The data show the estimated total amount saved by consumers who redeemed coupons.

Geographic reference: United States
Year: 2010
Market size: $3.7 billion
Source: Jean Chatzky, “How You Can Become a Coupon Queen,” USA Weekend, July 29-31, 2011, pages 6-7, 9
Original source: NCH Marketing
Posted on August 11, 2011

Judicial Campaign Ads on TV

State Supreme Court Campaign Funds

For many, the idea of electing a judge is an odd one. It seems strange to have judicial candidates handing out trinkets at the polling place when next they may be presiding over a court of law making decisions of a very serious nature. Yet for a variety of reasons, 22 States in the United States hold at least some competitive elections in selecting their State Supreme Court Justices. According to a new report by the Brennen Center for Justice, the volume of money being raised and spent on state-level judicial campaigns has been rising very sharply. In fact, many feel strongly that this infusion of money is undermining confidence in our very judicial system.

The graph shows the sum of all state supreme court campaign fundraising, by four-year election cycle, over a period of 19 years. The rise in fundraising is directly correlated to a rise in the quantities contributed by a small number of large donors, businesses and business groups for the most part. For more details, we recommend a close look at the source report.

Today’s market size is the quantity spent on television spots for candidates in State Supreme Court Judicial Campaigns during 2008 alone, a subset of the money presented in that graph for the years 2005-2008.

Geographic reference: United States, and more specifically, the 22 states that hold some competitive electorial process in the selection of their Supreme Court Justices
Year: 2008
Market size: $19,945,970
Source: James Sample, Adam Skagg, Jonathan Blitzer, Linda Casey, and Charles Hall, The New Politics of Judicial Elections 2000-2009: A Decade of Change, Figure 1 on page 5 and Figure 13 on page 26, August 2010, published by Brennan Center for Justice, National Institute for Money in State Politics, and Justice at Stake Campaign. The report is available online here.

Advertising

Advertising and Marketing Expenditures Worldwide

The United States is the undisputed leader worldwide when it comes to advertising, accounting for more than a third of all advertising and marketing expenditures worldwide. The chart shows the top ten countries by estimated advertising spending worldwide.

Please note that the graph is made from data that were produced in 2007 as a projection and much has changed since 2007. In fact, the summer of 2007 was a strange time, a time when investment firms were busy trying to pump confidence into a market that was weakening by the day. The report from which we got the figures used in the graph was published by Bear Stearns. In early 2008, Bear Stearns collapsed.

In a way, this example is a warning to all researchers to be careful when making assumptions about market data. By way of providing an interesting range of market sizes for Spending on Advertising and Marketing, we provide two measures for this overall market. One is from the Bear Stearns’ report produced in 2007 with projections for 2009. The other source is Advertising Age. Its estimates have the advantage of reporting on 2009 after the fact. The graph is based on the projected data since that report offered the country-by-country breakdown.

Geographic reference: United States
Year: 2009
Market size: Bear Stearns projection, $194 billion
Market size: AdAge estimate, $125 billion
Source: (1) Advertising & Marketing Services, Bear Stearns, July 2007, page 40. (2) Advertising Age, June 21, 2010, page 10.
Original source: ZenithOptimedia and Ad Age DataCenter.

Mobile Advertising Market

Mobile advertising is promotional activity designed to be delivered to cell phone, smartphone and other handheld device users. The market size presented here also includes Web-based search and display ads. As more consumers use smartphones and other handheld devices to access the Web, advertisers have devoted more money to mobile advertising. According to IDC, the mobile advertising market may double to $2 billion in 2011. Google had a 59 percent share of the market; Apple had less than a 10 percent share in 2010.

Geographic reference: United States
Year: 2009 and 2010
Market size: $368 million and $877 million respectively
Source: Olga Kharif, “Google Gains Market Share in U.S. Mobile Ads,” Bloomberg Businessweek, December 3, 2010 and available online here.
Original source: IDC

Licensed Merchandise at Colleges and Universities

This market includes all those things that are sold with college and/or university colors and logos on them, as long as they are licensed uses of these logos. Universities that lead the pack in terms of their licensed merchandise sales are Ohio State, University of Michigan, Texas, Michigan State, and Alabama.

Geographic reference: United States
Year: 2009
Market size: $2.2 billion
Source: The Register-Guard, December 27, 2009

Market for Sports Team Merchandise

The sale of team specific merchandise is big business. Merchandise is sold for teams at all levels, from pee wee to professional. This market size is based on merchandise for sports of all sorts at the college and university level as well as professional teams. Leading sellers of Major League Baseball merchandise include the New York Yankees (27.5% of the MLB merchandise sales), Boston Red Sox (8.3%), Philadelphia Phillies (8.0%), Chicago Cubs (7.1%), and Detroit Tigers (6.9%).

Geographic reference: United States
Year: 2009
Market size: $11.5 billion
Source: Detroit News, April 8, 2010
Original source: SportsOneSource

Size of Behaviorally-Targeted Online Advertising Market

Behaviorally-targeted advertising refers to the practice of using information collected about a user’s web-browsing behavior and then targeting the user based on his or her prior website visits.

Geographic reference: United States
Year: 2006 and 2009
Market size: $350 million and $1.1 billion respectively
Source: Walled Lake Journal, November 5, 2009, page B10
Original Source: eMarketer