
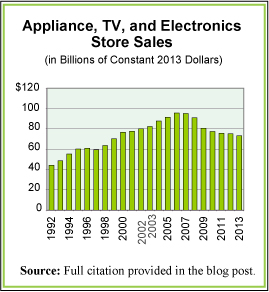
Today’s market size is the sales volume of appliance, TV, and electronics stores in the United States in 2013. Sales through these stores grew 26% from 2000 to 2013. However, as is often the case with a single measure, that single statistic does not tell the full story. Sales peaked in 2007 and between then and 2013 they declined by 15%. When one takes inflation out of the mix, the picture changes further yet. In inflation-adjusted dollars, sales from 2000 to 2013 actually fell by 5% and between 2007 and 2013 they fell by 23%. The trend is clear in the graph we provide which shows sales annually in inflation-adjusted, constant 2013 dollars.
Geographic reference: United States
Year: 2013
Market size: $73.29 billion
Source: “Estimated Annual Sales of U.S. Retail and Food Services Firms by Kind of Business: 1992 Through 2012,” Annual Retail Trade Survey 2012, U.S. Census Bureau, March 31, 2014, available online here. “Retail and Food Service Sales,” January 2014 Monthly Retail Trade and Food Service Report, U.S. Census Bureau, March 13, 2014, available online at the same site linked to above. Constant 2013 dollars were calculated using “Table 1.1.9. Implicit Price Deflators for Gross Domestic Product,” part of the National Income and Products Accounts Tables produced by the Bureau of Economic Analysis and available online here.
Original source: U.S. Department of Commerce, Bureau of the Census and Bureau of Economic Analysis
Posted on April 4, 2014